SharePoint 2010 Logging Improvements – Part 2 (Introducing Developer Dashboard)
Developer Dashboard is a powerful troubleshooting tool which will enable engineers to perform advanced troubleshooting directly from the page that is rendering. Developer Dashboard provides a plethora of diagnostic information consolidated into sections. The sections within developer dashboard provide advanced details of various aspects of page rendering. Sections will be broken down in greater detail later in this nugget. This nugget will take a look at Developer Dashboard and some examples of how it can be used to troubleshoot SharePoint performance issues. Special thank you goes out to Dan Winter & Umesh Unnikrishnan for the knowledge transfer and Dan a second time for tech reviewing this nugget.
Two great things come as a result of developer dashboard use.
Proactive : SharePoint Developers will utilize Developer Dashboard to test\diagnose customizations to pages before deploying to production.
Reactive: SharePoint Administrators will utilize Developer Dashboard to monitor performance of page loads. Also, SharePoint Administrators will use Developer Dashboard to troubleshoot a variety of issues involving rendering of pages.
For Example, Developer Dashboard will display any values that exceed acceptable ranges will be shown in red. Mousing over any value provides a description of what the value is showing as well as how you can fix it.
Customizability
SPMonitoredScopes and ISPScopedPerformanceMonitor
Before diving into Developer Dashboard tool, it’s necessary to explain some extensibility information like SPMonitoredScopes and ISPScopedPerformanceMonitor. Developer Dashboard monitors various performance characteristics and resource usage of any piece of code by wrapping it within a SPMonitoredScope. SPMonitoredScope can measure the following indicators:
· Execution time (in milliseconds) times the execution.
· Number of SPRequests
· Number of SharePoint sql queries (including the query text)
Results are written to Developer Dashboard as well as the ULS logs. It’s possible to create custom monitors for your own resources by implementing ISPScopedPerformanceMonitor and adding that monitor to the current SPMonitoredScope. For more detailed information on both SPMonitoredScope and ISPScopedPerformanceMonitor, please see the links section at the bottom of the nugget.
Adding Developer Dashboard to custom pages
It’s possible to add developer dashboard to your own page by either using the SharePoint v4.master page or adding the two controls to your page. The first is a launcher icon to enable the dev dashboard on demand. The div will define where the dashboard shows up. The final control must be at the very end of your page (or else you won't capture all of the operations during rendering).
For Example:
<Sharepoint:DeveloperDashboardLauncher
ID="DeveloperDashboardLauncher"
NavigateUrl="javascript:ToggleDeveloperDashboard()"
runat="server"
ImageUrl="/_layouts/images/fgimg.png"
Text="<%$Resources:wss,multipages_launchdevdashalt_text%>"
OffsetX=0
OffsetY=78
Height=16
Width=16 />
<div id="DeveloperDashboard" class="ms-developerdashboard" />
<SharePoint:DeveloperDashboard runat="server" />
Performance Counters
Developer Dashboard contains an extensible mechanism for measuring various performance counters at various scopes. Within Developer Dashboard, the following performance counters are used to monitor usage and resource consumption at each stage of the requests.
Per-Thread Counters (these measure actually values for the current request or timer job):
- Execution time
- SPRequests Allocated
- Number of Sql Queries performed
- The duration of each sql query
- The query text of each sql query
- Url (or timer job name)
- Current User
- Start time
Per-Process Counters
- Global heap size
- Total size of all native heaps
- Number of native heaps
- Number of active native heaps
- Number of SharePoint operations in progress
Client Counters
- Page Size
System Counters (these include any System Performance Counter, these are just examples)
- Managed memory heap size
- Hard page faults
- Processor utilization
- Available memory on the machine
Note : Any values that exceed acceptable ranges will be shown in red.
Performance Impact
A common question from customers is going to be the following:
What is the additional performance impact of enabling Developer Dashboard in my farm?
Answer: Enabling developer dashboard only consumes a few thousand cycles on the CPU which is very minimal impact. When someone clicks on the developer dashboard icon, that one browse will slow down by about 10ms for heavily customized pages. The 10ms delay occurs because when developerdashboard=On, more data is written to ULS logs. Simply put, the 10ms is spent writing additional entries in the ULS logs. This in turn can have an impact on the disk subsystem if developer dashboard is left on for a long period of time. That is, the disk subsystem is unable to sustain the additional disk transfers.
Activate and Enable Developer Dashboard
Developer Dashboard is turned off by default. Developer Dashboard is turned on by either STSADM command or using a PowerShell Script. Developer dashboard has 3 different modes “options”. The first mode is the default setting which is off. On mode displays developer dashboard for every page render. Finally, OnDemand mode enables Developer Dashboard but it’s not visible until a user manually activates it by selecting the DevDashboard icon.
Note: The examples below demonstrate OnDemand mode
Using STSADM
The following command enables Developer Dashboard:
STSADM –o setproperty –pn developer-dashboard –pv OnDemand
Using PowerShell
The following PowerShell script enables Developer Dashboard:
$DevDashboardSettings = [Microsoft.SharePoint.Administration.SPWebService]::ContentService.DeveloperDashboardSettings;
$DevDashboardSettings.DisplayLevel = 'OnDemand';
$DevDashboardSettings.RequiredPermissions = 'EmptyMask';
$DevDashboardSettings.TraceEnabled = $true;
$DevDashboardsettings.Update()
This turns on Developer Dashboard for the entire farm meaning all sites are enabled.
DevDashboardSettings.RequiredPermissions determines which users will see the developer dashboard. EmptyMask means all users will be able to access developer dashboard. Any mask available in SPBasePermissions object can be used to filter down to a specific group so that only a small subset of users will be able to access developer dashboard.
This is set for the entire farm. Once script executes, the following icon is displayed on the top right of the page:
To activate developer dashboard, simply hit the icon circled in red above.
When enabling developer dashboard in production, it’s likely an Administrator wants to restrict access so that only a few select users know it’s enabled. As long as display level is set to “OnDemand” the following steps make this possible:
1. Remove the icon by editing the master page.
2. Access Developer Dashboard by appending ?Developer Dashboard=true as a query parameter.
For Example: https://contosoweb/default.aspx?DeveloperDashboard=true
After clicking on the Developer Dashboard icon, the bottom of the page will look like the following:
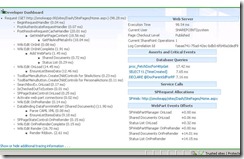
This provides some great diagnostic information and outputs what is going on behind the scenes. The dashboard consists of 7 sections which are discussed in more details below.
Sections
Developer Dashboard section
This resides on the left (see above screenshot) and displays all of the SP Request objects that were generated from the page render. This is typically used by developers so it’s outside the scope of this nugget.
Web Server section
· Execution Time – Time taken to render page
· Current User – User logged in
· Page Checkout Level – Great for quick check of whether a page is checked out or not
· Current SharePoint Operations – number of active requests (SPRequest) across all active threads—showing the load against SQL at that moment
· Log Correlation Id – This can be used to filter down the corresponding ULS logs to view trace level events based on this specific page render\conversation
Note: SharePoint error pages typically provide correlation ID but this is a method to obtain Correlation Id if SharePoint page fails to produce error.
As demonstrated, the web server section is a quick way to gather some basic information on page render.
Asserts and Critical Events section
Errors and critical events are displayed in this section. They include the details on the exact error with correlation ID appended. The call stack is also mapped to the critical event. You can access these details by clicking on the actual critical event.
Database Queries
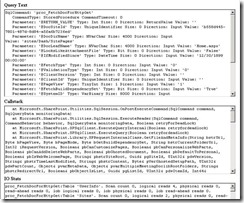
This section outputs every database query that happened during page render and time of execution. Clicking on each query provides the following information:
· Query Text: This contains the full SQL query
· Callstack: Provides call stack where SQL query originated. This is beneficial where debugging is required to mine the call stack of poor performing and\or suspect SQL queries.
· IO Stats: This provides the I/O footprint on the specified SQL query. Great, for looking into expensive queries to see if excessive read/writes are encountered.
This greatly reduces the time in troubleshooting page render performance issues when expensive SQL queries are suspected. Prior to developer dashboard, we heavily relied on SQL tools running on the back end to provide this information because ULS logs typically only output a partial of the full SQL query. This doesn’t guarantee that a performance bottleneck is going to be captured by only using Developer Dashboard. However, it’s a great first step to quickly determine if queries are expensive and why by using Query Text, Callstack, and IO Stats information.
Service Calls section
Displays calls to web services (WCF) calls on a back-end such as calling search or profile web services. This is a good indicator of web service response time on the back end. For Example, search results are taking longer than expected.
SPRequest Allocations section
Displays SP Request allocations and can be used to check whether or not SPRequest objects are properly set to dispose.
For Example clicking on the link in the screen shot provides this output:
AllowCeanupWhenThreadEnds is set to true so this is set to properly dispose.
WebPart Events Offsets section
Displays how long it takes for web parts to render.
In the above example, VisualWebPart1 is taking 5 seconds to render. Using developer dashboard in this manner provides a SharePoint Administrator a simple way to identify poorly performing web parts during page load.
Developer Dashboard is a powerful tool to quickly troubleshoot, diagnose, and resolve slow page loads or general page rendering issues. Several causes of page loads will now be easier to identify thanks to the various sections included in Developer Dashboard.
More Information:
SPMonitoredScope
ISPScopedPerformanceMonitor
-Russ Maxwell, MSFT
Comments
Anonymous
May 27, 2010
Great Article! One minor correction to the stsadm command to enable the Developer Dashboard. STSADM –o setproperty –pn developer-dashboard –pv OnDemand Should Be STSADM –o setproperty –pn developerdashboard –pv OnDemandAnonymous
September 12, 2010
It it possible to enabled the developer dashboard for forms based authenticated users? I've tried altering the requiredpermissions enum but with no luck. The dashboard is definitely enabled as when I log onto the custom site usign Windows Auth or when viewing a settings page I see the stats etc.Anonymous
March 11, 2011
Nice post. The way you written is appreciated sharepointsolution2010.blogspot.com/.../enablingdisabling-dashboard-with.htmlAnonymous
January 19, 2012
Useful post.


