Introducing Web Analytics in SharePoint 2010
Guest post by Sangya Singh
As part of SharePoint Server 2010, we have created a new set of features to help you collect, report, and analyze the usage and effectiveness of your SharePoint 2010 deployment – whether it’s used as an internal or external web portal, a collaboration tool or a document and records management repository. These features are part of the Web Analytics capabilities of SharePoint 2010.
This blog post is the first of several that will give you more insight into the enhanced Web Analytics features that we have built into SharePoint 2010. This first post will provide an overview of the new Web Analytics features and we’ll take a deep dive in to specific scenarios in future posts.
Overview
Web Analytics Reports
In SharePoint 2010, we have improved the set of Web Analytics reports that are available out-of-the-box, which will provide insights into the behavior of users of your SharePoint sites. There are three categories of reports that you will find:
- Traffic reports: These reports provide metrics such as:
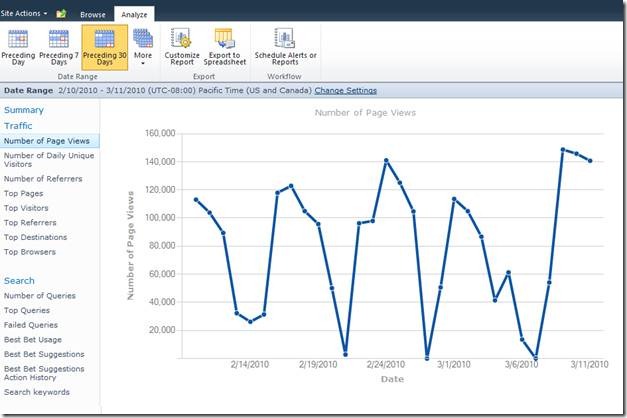
- How much traffic your site gets (Number of Page Views);
- Who visits your sites (Top Visitors);
- How visitors arrive at your site (Top Referrers);
- Daily Unique Visitors, Top Destinations, Top Browsers, etc;
- Search reports: These reports give you insight into what users are searching for, for example:
- How many times users searched (Number of Queries);
- What were the most used search terms (Top Queries);
- What queries have high failure rates (Failed Queries);
- Best Bet Usage, Search keywords, etc;
- Inventory reports: These reports display key metrics regarding the inventory of your sites:
- What is the total disk drive space user (Storage Usage);
- How many sites exist (Number of Sites);
- Top Site Product Versions, Top Site Languages, etc;
We aggregate these reports aggregated at the following levels:
- Per web application in the farm
- Per site collection
- Per site
- Per search service application
Out-of-the-box, these reports are visible to Administrators at each level. For example, site-level reports are available to Site Administrators of those sites. We have also added a new permission level, “View Web Analytics Data,” that will allow users to access these reports without having to give them Administrator privileges.
You can access Web Analytics reports by going to Site Actions -> Site Settings. Under the Site Actions heading you will see two links, Site Web Analytics Reports and Site Collection Web Analytics Reports.
When you click on either link, you are taken to an overview page that shows you key metrics for your site. You can then drill down to other reports by clicking on them on the left navigation. You can also change the date range for the reports by clicking on the Analyze tab on the Ribbon.
Custom Web Analytics Reports
The out-of-the-box reports are useful to get a general understanding of what is happening on your sites. However, we have made it easy for you to get a deeper level of analysis, or to simply create your own reports. To get started, click on the Customize Report button under the Analyze tab in the Ribbon. Clicking this button will export the data contained in this report to Excel. Excel is a power analytics tools and makes it easy for non technical users to add your own charts, set specific filters, and combine data from multiple reports. In addition, the data within Excel is refreshable, which means that, once you customize the report, it will always be up-to-date with the latest data. To get more details on the great new features in Excel 2010 for building charts, reports and pivot tables, take a look at the Excel Team blog.
Web Analytics Workflows
Web Analytics Workflows is a powerful new feature set that enables you to get reports sent out either on a schedule or when specific conditions are met. For example, you can set them up to receive an email every time the total number of pages views drop by 80% week over week.
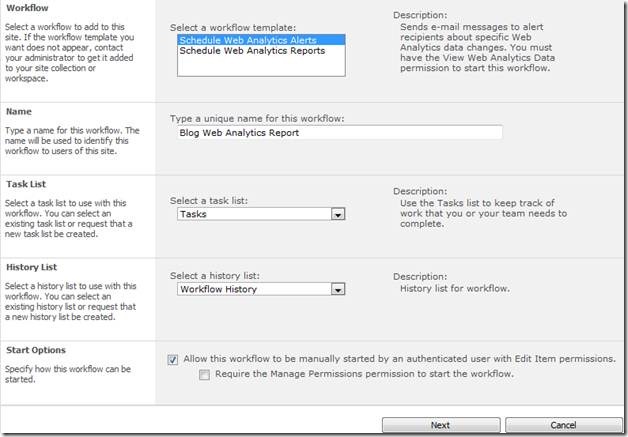
To setup a Web Analytics Workflow, go to the Web Analytics report that you are interested in and click on Schedule Alerts or Reports on the Analyze tab in the Ribbon.
Clicking this button will guide you through a series of steps to create your Workflow.
Best Bets Suggestions
Best Bets allow Search Administrators to determine what the most relevant search result is for a given keyword. Up until now, Search Administrators had to look at different reports and data to determine which best bets needed to be added. That process is no longer necessary as SharePoint 2010 periodically sends out suggestions for new Best Bets using all the search metrics it has collected. Now, Search Administrators can simply look through each of the Best Bet suggestions and easily accept or reject them.
To access the Best Bet Suggestions, go to Site Actions, click on Site Collection Web Analytics Reports, and the click on Best Bets Suggestions on the left navigation.
Web Analytics Web Part
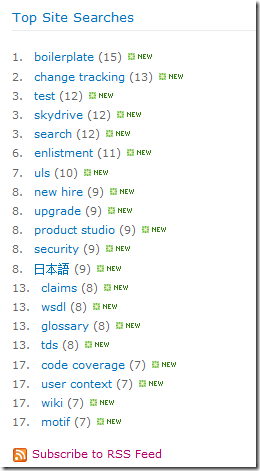
We have created a new web part, the Web Analytics Web Part, targeted at Site Managers. This new Web Part is an end-user facing Web Part that can be easily inserted into any page on your site. It can be configured to display the ‘most viewed content’ or the ‘most frequent search queries’ in the site. The data in the Web Part is continuously refreshed as new content or new search queries become more popular.
To use this Web Part, go into the Edit mode of one of your Site Pages and click on any place you can add a Web Part. Then, from the Insert tab on the Ribbon, click on Web Part. Finally, click on the Content Rollup category and select the Web Analytics Web Part.
After you have inserted the Web Analytics Web Part, you can then configure it to display the data you are interested in.
Conclusion
Using the new Web Analytics features in SharePoint 2010, you will be able to get a deeper understanding of what users are doing, what they want from your site and how you can tailor the SharePoint experience to bets meet their needs. Keep an eye out for future posts where we will delve deeper into each of the features mentioned above.
Comments
Anonymous
June 07, 2010
is it available in Sharepoint 2007?Anonymous
November 15, 2010
What is the difference in Site Web Analytics Reports and Site Collection Web Analytics Reports? I thought one was for the Whole Site Collection and the other for just the site and not sub-sites but that does not appear to be the case.Anonymous
February 17, 2011
Is it possible to get the Web Analytics data programmitcally? I have a similar requirement as this one: social.msdn.microsoft.com/.../f861258e-af95-443a-bca3-75b96e418162 Basically, I need to use analytics data to render something more interesting than the OOTB Web Analytics Webpart. Beside the GetUsageBlob() methods that requires non-trivial parsing effort, is there any other API?Anonymous
May 05, 2011
I think it would be helpful to take a look at CardioLog to meet your analytics needs. CardioLog has an open API platform for report customization and tracking of custom web events. To download a free-30 Day Trial of our Enterprise Edition, please go here: www.intlock.com/intlocksite/Downloads/cardiolog/cardiolog-ent-request-trial.asp. Or, for more information on CardioLog's SharePoint Analytics Solution, go to www.intlock.com


