SSRS and Microsoft Chart Control How To: Change the Width of Bars and Columns
Every once and I while I get asked this question, and it fits nicely with a series I've been planning to blog on what you can do with custom attributes in charts in SQL Server Reporting Services 2008. The question is, "How do I change the width of the bars and columns on the charts?".
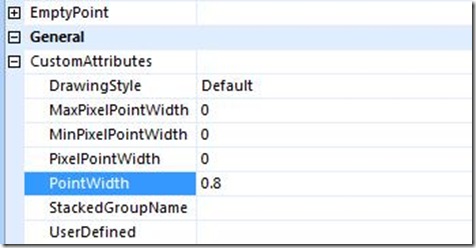
To change the width of bars or columns on a chart, you need to access the custom attributes for the charts. In Report Builder 2.0, you do this by going to the ribbon under the View area and check the "Properties" checkbox. This will enable the property grid that people who use the BI Development Studio are familiar with. Next, select the series you are interested in on the chart, either via the chart flange or by selecting the bar or column on the chart. Look over to the property grid and look for a section called "General". Under the "General" heading there is an area for custom attributes. Expand the custom attributes node and you will see the following.
Right there under custom attributes you can change the relative size of the point widths. Anything less than 1 will create space between the bars and columns. Anything greater than 1 will cause the bars or columns to overlap.
Custom attributes also work on the ASP.Net and Winforms chart that we just released.
Here's a code snippet that'll do the same thing if you are using the stand-alone controls.
VB ' Set the Series PointWidth. Chart1.Series(0)("PointWidth") = "1.2"
C#
// Set the Series PointWidth.
Chart1.Series[0]["PointWidth"] = "1.2";
I'll be posting more on custom attributes very soon.
Comments
Anonymous
October 30, 2008
PingBack from http://mstechnews.info/2008/10/ssrs-and-microsoft-chart-control-how-to-change-the-width-of-bars-and-columns/Anonymous
June 08, 2013
Good article !!!Anonymous
October 03, 2013
But what if we want spacing only between 2 particular bars?Anonymous
August 10, 2014
How to change width bar chart in rdlc reportAnonymous
May 12, 2015
I have set the PointWidth property as stated above. But this seems to make chart column grow depending upon chart area. My report contains many chart controls inside one table.... depending upon column value above the chart the chart area increases or decreases, this causes the bar within chart to increase or decrease respectively. I need to find a property that will make my chart column of fix width. I tried using PixelPointWidth, MaxPixelPointWidth and MinPixelPointWidth but no use.... One thing i noticed that, this issue only comes when viewing report inside report viewer and not when previewing the report in report builder. Any help please.Anonymous
October 04, 2015
Ummm.....first post has link that looks like a Java updater that is highly suspicousAnonymous
November 23, 2015
Fix the column width like this: <CustomProperty> <Name>MaxPixelPointWidth</Name> <Value>12</Value> </CustomProperty> <CustomProperty> <Name>MinPixelPointWidth</Name> <Value>12</Value> </CustomProperty>
