Project 2010: Business Intelligence Overview
This post will provide an overview of the Business Intelligence (BI) investments that were made in Microsoft Project Server 2010.
A Brief History
In Microsoft Office Project Server 2007, the focus for reporting was on infrastructure, where we provided the infrastructure to make accessible reporting data available. The new reporting database allowed you to more easily query data from Project without the need for advanced SQL skills. The OLAP Database was also enhanced to 13 new cubes to provide richer data.
Feedback indicated a need to provide further data segmentation of OLAP data. Since we only had the one OLAP database, it contained all data. Administrators wanted the ability to build more targeted and smaller OLAP databases based on a particular user audience. They also needed a way to easily customize what data was contained within the OLAP database. For example, having cost data in an OLAP database that was used by contractors made many administrators nervous.
For accessing the data, we also released two SQL Server Reporting Service (SSRS) Report Packs. Feedback indicated that this was a step in the right direction, but any solution that started with “Open Visual Studio” didn’t address the core data accessibility issue. Another issue was the people who typically need to create reports don’t usually have the requisite SQL skills or access to programming tools to write the reports for SSRS.
Project Server 2010: Make Data Richer and Easily Accessible
Consequently, three major investments were made in Project Server 2010 in OLAP, the Reporting Database and in Excel integration to address these needs.
Multiple OLAP Database Support
Multiple OLAP Database support enables the administrator to configure, customize and provision OLAP databases based on the particular needs of the target audience. There are two primary ways that the OLAP database can be customized.
Filtering the Data
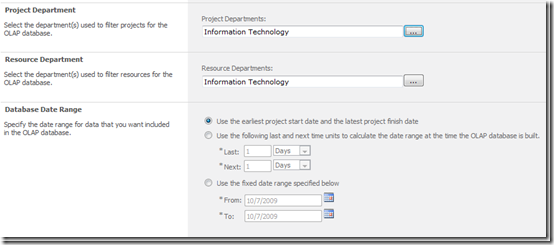
In Project Server 2010, an OLAP database’s data can be filtered based on a combination of date range, Project Department and Resource Department. This provides a way to easily filter the OLAP data to the information relevant to a given user group. In this case, the Information Technology OLAP database will only contain project and resource data that is assigned to their department. No more having to filter out the Marketing projects to get an IT report!
Controlling The Data Elements Published
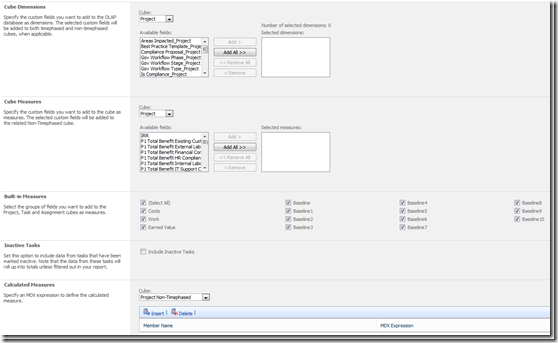
The second way of customizing an OLAP database is to specify which data elements are included in a given database. The ability to add or remove custom fields as dimensions and measures is an easy operation. For intrinsic data such as baselines and cost data, you can exclude the data from the OLAP database by merely deselecting the box for that data type. If you are using the new Inactive Tasks feature, you can also easily exclude this task type from the OLAP data. Lastly, if you like handcrafted MDX, you can add your own calculated measures to the database via the user interface.
New Data in the Reporting Database
A number of new data elements were added to the Reporting database in this release. Now it is possible to create report using Timesheet administrative time data and timesheet custom fields data. This enables the user to get a much richer view of where time has logged, as well as other uses like a list of planned vacation time or planned training time. We also added data related to the new portfolio and workflow functionality. Lastly, if you’ve used project properties in the past in Project Professional, these are now populated into the Reporting database.
Excel Based Reporting
In order to make data easily accessible, we need to use a tool that most people already have and know how to use. Since the most commonly used tool for BI data visualization is Excel, it was a natural fit for the need. Excel also made it easier for end users to extend the solution with creating new reports or assembling reports into a dashboard.
In enabling the use of Excel as our BI solution, we made the following investments:
New Business Intelligence Center
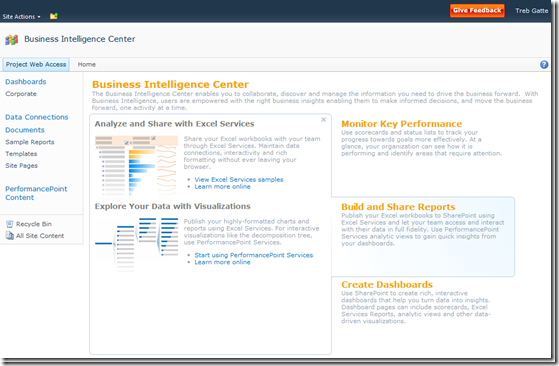
This new website is created beneath PWA to house Excel, SSRS and PerformancePoint content. This enables a one stop shop for all BI needs.
Pre-Connected Excel reports
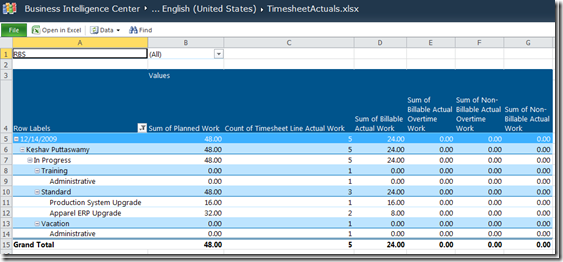
Connecting users to their data proved to be a challenge for many. Therefore, we provide some pre-configured and pre-connected reports which can be used as dashboard components or as report starters to build your own version. The example below is the Timesheet Actuals report, which was built based on the needs of a customer who was using our time tracking solution in Project Server 2007.
Pre-Connected Reporting Database Templates
We also provide pre-connected blank templates for report creation over the Reporting database. These templates focus on key entities within Project Server. This makes it much easier to create quick reports on these specific items. The templates are:
- Dependent Projects
- Issues
- Project And Assignments
- Projects And Tasks
- Resources
- Risks
- Timesheet
Automatic Pre-Connected Template Creation for OLAP Databases
When an administrator builds a new OLAP database, Project Server 2010 will automatically create a pre-connected blank template for each of the 14 cubes. This makes it easy for a user to create reports quickly. These templates include:
- OlapAssignmentNonTimephased
- OlapAssignmentTimephased
- OlapDeliverables
- OlapEpmTimesheet
- OlapIssues
- OlapPortfolioAnalyzer
- OlapProjectNonTimephased
- OlapProjectSharePoint
- OlapProjectTimesheet
- OlapResourceNonTimephased
- OlapResourceTimephased
- OlapRisks
- OlapTaskNonTimephased
- OlapTimesheet
In addition to the templates, an Office Data Connection library is created and pre-populated. These connections are used by the templates and sample reports, and these remove the need for the user to know the server name, database name and SQL. In all cases, users can copy and modify these files to extend the reporting to meet their own needs.
Lastly, multi-lingual support is now provided. For each language pack installed on the server, a folder with the requisite templates for each language will be generated.
Pulling It All Together
In the end, you can use Excel reports to share information, either by email, SharePoint or aggregating a number of reports into a dashboard.
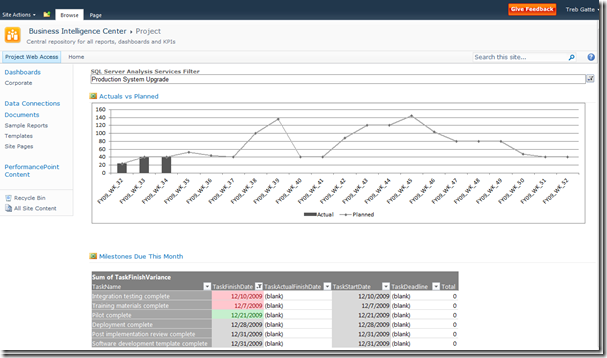
In the dashboard example below, I’ve created a Project Dashboard which shows me a time phased look at actual work versus planned work for the project, as entered from My Tasks. Below it, I can see upcoming milestones report, which has time based conditional formatting of the Finish Date to highlight overdue milestones and upcoming milestones. With this, I can see if hours were logged against the project as planned and see what milestones are impacted if the numbers are low.
Comments
Anonymous
January 18, 2010
Heather, thanks for this article, I have been looking for some BI reference material. We have installed Ps2010 beta and have built the OLAP cube successfully...we are looking direction for step #1 to connect to the data source (OLAP)..can you be of assistance? Thanks NealAnonymous
February 03, 2010
Where did the reports options go to in the 2010 beta client? I can't see anything obvious and there's nothing in the help file either... :-/Anonymous
February 04, 2010
They are on the Project tab in the Reports group.Anonymous
March 16, 2010
Neal - any progress on connecting to an OLAP data source? I need to do the same.Anonymous
April 05, 2010
Hi, What is the extent of Excel client 2003 compatibility for clients still on this version? -Dan`Anonymous
August 29, 2010
I WAS looking to upgrade to Project 2010 but I see no way to save Access files from which to generate reports. It now LOOKS like the expectation is purchase of Project Server and maybe more software with the associated install and configuration hassles. Am I really that cut-off from my data (again)?Anonymous
September 02, 2010
What kinds of reports were you creating? In Project 2007 we added a feature called Visual Reports. You can use this to create charts and such in Excel based off your project data. You don't need project server to use this feature. You can learn more about it here - blogs.msdn.com/.../visual-reports.aspxAnonymous
March 23, 2011
Must you install SSRS in SharePoint integrated mode for SSRS functionality (i.e. Project Web App -> Reporting Services Reports) to work?Anonymous
March 24, 2011
This TechNet article outlines the supported features by SSRS in SP Integrated mode: technet.microsoft.com/.../bb326290.aspx The short answer is yes - in order for the OLAP cubes to work with Excel & Performance Point Server, SSRS must be installed in integrated mode on-premise.
