VS2010: Attaching the Profiler to a Managed Application
Before Visual Studio 2010, in order to attach the profiler to a managed application, certain environment variables had to be set using vsperfclrenv.cmd. An example profiling session might look like this:
- vsperfclrenv /sampleon
- [Start managed application from the same command window]
- vsperfcmd /start:sample /output:myapp.vsp /attach:[pid]
- [Close application]
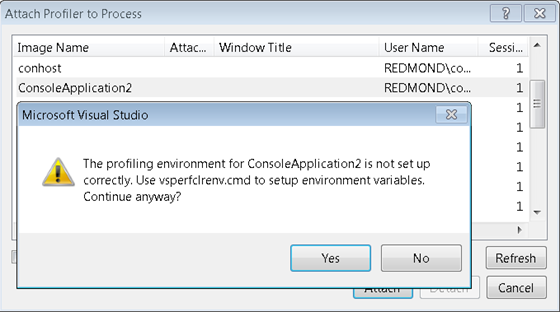
If the environment variables were not correctly set, when attempting to attach you would see this message:

The profiling environment for ConsoleApplication2 is not set up correctly. Use vsperfclrenv.cmd to setup environment variables. Continue anyway?
The generated report would typically look something like the report below. The warning at the bottom of the page indicates the problem and the report itself would typically not be useful since no managed modules or functions would be resolved correctly.
 Report with 'CLRStubOrUnknownAddress and Unknown Frame(s) and the warning ‘It appears that the file was collected without properly setting the environment variables with VSPerfCLREnv.cmd. Symbols for managed binaries may not resolve’.
Fortunately the Common Language Runtime (CLR) team provided us with a new capability to attach to an already running managed application without setting any environment variables. For more detailed information take a look at David Broman’s post.
Caveats:
- We only support attach without environment variables for basic sampling. It will not work for Allocation or Object Lifetime data collection and Instrumentation attach is not possible. Concurrency (resource contention) attach is supported.
- The new attach mechanism only works for CLR V4-based runtimes.
- The new attach mechanism will work if your application has multiple runtimes (i.e. V2 and V4 SxS), but as noted above, you can only attach to the V4 runtime. I’ll write another post about the profiler and Side by Side (SxS).
- The old environment-variable-based attach still works, so you can still use that if you prefer.
The new procedure for attaching the profiler to a managed application in Visual Studio 2010 goes like this:
- Launch your app (if it isn’t already running)
- Attach to it, either from the command-line or from the UI.
- When you’re finished, detach or close the app to generate a report.
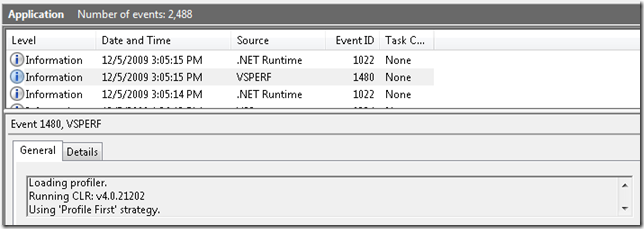
If you want to diagnose any issues with attach, the CLR V4 runtime provides diagnostic information via the Event Log (view with Event Viewer) and the profiler also displays information there:
Event Log: ‘Loading profiler. Running CLR: v4.0.21202. Using ‘Profile First’ strategy’
There are two .NET Runtime messages regarding the attach, the first indicating that an attach was requested and the second that the attach succeeded. The VSPERF message describes which CLR is being profiled.

