Part 1 - ETW Introduction and Overview
Introduction:
Event Tracing for Windows (ETW) is a system and software diagnostic, troubleshooting and performance monitoring component of Windows that has been around since Windows 2000. However, it wasn't until Windows Vista that major components of the OS were updated to heavily use ETW tracing; making it much more practical and useful.
ETW is useful from a variety of scenarios, including:
-User & Admin: Being in control of your system and knowing what is going on.
-User & Admin: Troubleshooting performance, hardware and OS issues.
-Enthusiast: Learning further about the OS and the low level guts of the OS.
-Software Developer/ISV/OEM: Investigating issues with your software's interaction with Microsoft OS & technologies
-Hardware Developer/IHV/OEM: Investigating issues with hardware interaction with the OS, including kernel, driver subsystems, up to the user stack.
ETW is a set of technologies and tools that can absolutely complement existing tools while providing a look into the guts of the OS at a very low level.
A great article from the April 2007 edition of MSDN Magazine - https://msdn.microsoft.com/en-us/magazine/cc163437.aspx, covers ETW in great depth, and is recommended reading.
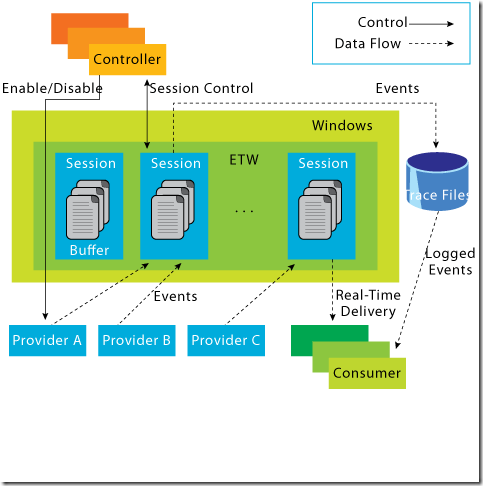
Here is graphical overview of the ETW infrastructure that covers how provider(s) log to high performance in memory buffers, which can be kept in memory in a circular buffer, or written to disk in a sequential or circular fashion.
Some uses of ETW:
Today on Windows Vista, Windows 7, and sparingly on earlier OSes; ETW is used by Microsoft Development and Microsoft Support, as well as others; to help troubleshoot issues, find root-cause of bugs, analyze performance; and a large variety of other tasks.
As it stands today, ETW has two major thrusts:
1. Exposing time-based event data similar in practicality to plain old text based logged (without the normal performance overhead). Troubleshooting logs have long been used across the industry by software developers and IT professionals to troubleshoot issues. Here are some examples of how ETW logging is used.
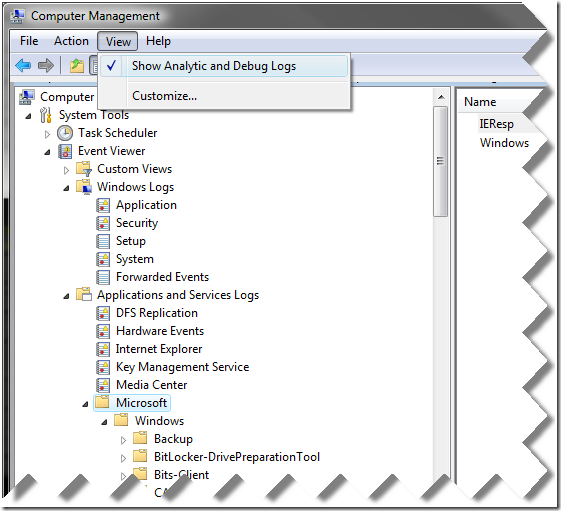
First off, shown below is Windows Event Viewer enabling viewing of analytic and debug logs (which show you many more logs than the default view):
A variety of logs can be viewed graphically using the Event Viewer or via the built-in command line OS utility – wevtutil. There are a quite a variety of logs that are enabled by default and are available via the Event Viewer or in a kernel memory dump.
Since ETW is also a foundational component, you might find it appearing in other troubleshooting utilities. For example, Office Communications Server 2007 uses ETW for troubleshooting.
ETW is used to monitor for network events from the kernel which are then added to Process Monitor, a utility from Microsoft Sysinternals. You should also see tools such netsh and NetMon being able to capture and decode ETW traces.
There are many other methods and utilities to view the ETW tracing providers available, which may be found in the OS, via the Device Driver Kit (DDK), enabled with Microsoft products (such as Exchange or IIS), or used by tools, such as Office Communication System Logging.
The second major thrust of ETW is exposing performance data.
2. Performance data is exposed from the lowest levels of the kernel, driver subsystems, and every major user-mode component of Windows (such as Windows Media Player).
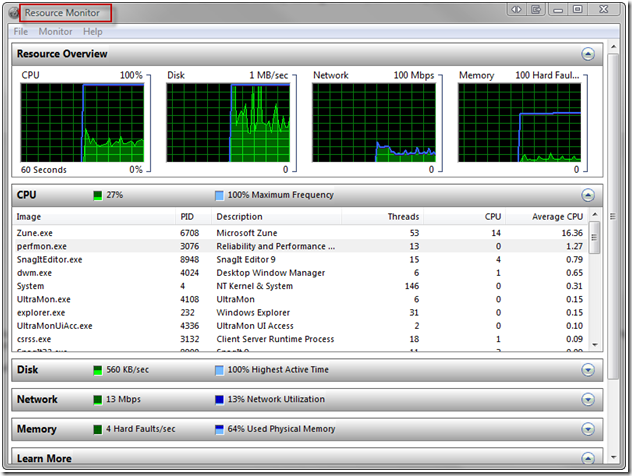
Performance data can be used in a hybrid fashion both for troubleshooting and performance reasons. Take for example a built in OS tool that uses ETW tracing to provide rich data - Resource Monitor.
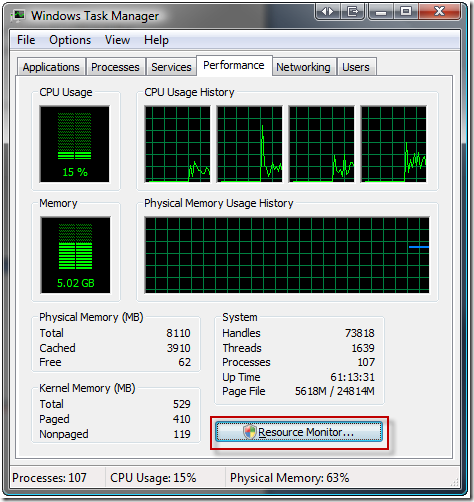
Resource Monitor is available from the Windows Task Manager - Performance Tab. The cool thing about Resource Monitor is that it internally uses kernel ETW tracing to gather its data, providing rich data from the kernel itself; and thus providing a practical exposure of ETW technology for Administrators to troubleshoot their systems. This goes beyond the data that Task Manager provides, which often tends to be based on performance counters which you cannot drill down into further.
Resource Monitor is useful from both a performance standpoint, as well as troubleshooting. For example, you can view top cpu users, top disk users (why your disk is thrashing), or search for a locked file handle that is open.
For a deeper drill-down into performance data XPerf can be used to capture ETW traces and make them available for decoding offline (on another box).
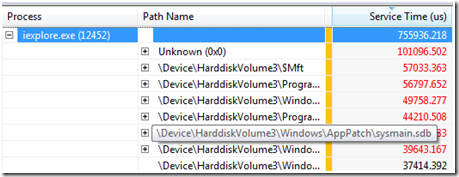
Here, Xperf (available with the Windows DDK and as a standalone download) is shown looking at Internet Explorer's file access time.
There have been several posts on the NTDebugging Blog regarding XPerf, other blog posts, as well as the Windows Performance Analysis Dev Center.
Where to go from here:
In Windows 7 and Windows Server 2008 R2, ETW tracing has even been further improved with many more providers including 600+ inbox providers’ registered on the box. This number increases when add-on features or products are installed (such as Hyper-V).
The tracing provided by ETW, whether it is used directly in the OS, or via add-on tools, provides deep insight into Windows and how it works. We will explore ETW in depth in future blog posts.
| Share this post : |  |
Comments
Anonymous
December 14, 2009
Excellent Post , the resource monitor information was great !Anonymous
January 25, 2010
Great series!! Let me know ETW more, Thanks!!
