Use Microsoft Operations Management Suite to track PowerShell activity
Summary: Learn how to add the PowerShell activity log to MSOMS and how to search that collected log.
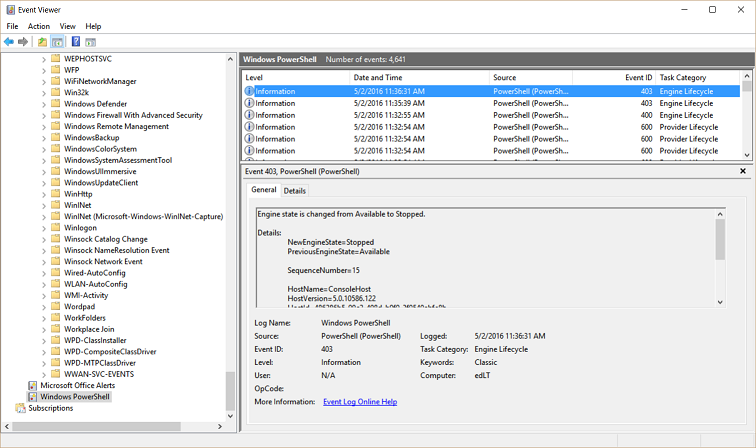
Good morning, everyone, Ed Wilson here, and today I want to talk about how to use Microsoft Operations Management Suite to track Windows PowerShell usage. By default, Windows PowerShell records activity to several different logs. For example, there is the Windows PowerShell log that provides information about the Windows PowerShell engine and provider lifecycle. An example of such an event is shown here:
There are also the Windows PowerShell Admin and Operational logs as well as Desired State Configuration (DSC) logs. So, it's a pretty well logged application. For most purposes, the Windows PowerShell logs provide great diagnostic information, and that can be great when there is a problem that requires some research.
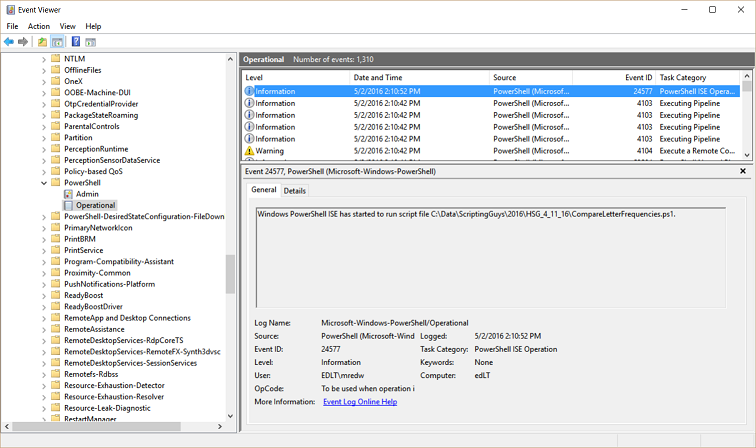
One log that has the potential to be pretty cool at any time is the Windows PowerShell/Operational log. Among other things, the operational log records when a Windows PowerShell script runs. An example of such an event is shown here:
The information from the Microsoft-Windows-PowerShell/Operational log that most interests me appears in the Details tab. I can see the name of the script that runs and the user who runs the script. The Task Category is PowerShell ISE Operation, so I know that the script was run interactively from within the integrated scripting environment (ISE). All this information comes from Event ID 24577.
So, can I do this in Microsoft Operations Management Suite? Absolutely.
First select the log to ingest into MSOMS
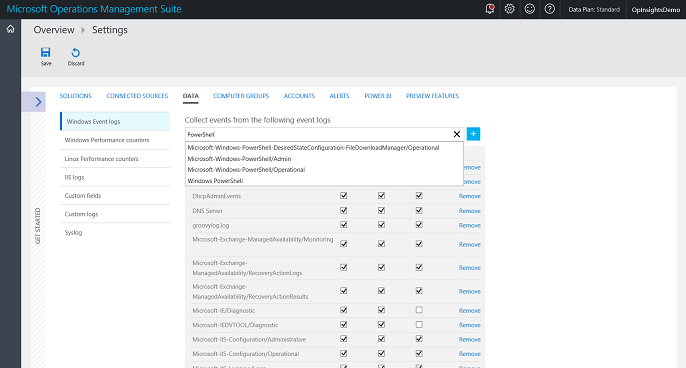
From my OMS home screen, I select Settings > Data and, in the Collect events from the following logs box, I type PowerShell. This is shown in the figure here:
After I type PowerShell, all I need to do is to select the Microsoft-Windows-PowerShell/Operational log from the list of logs. Then, I click the plus ( + ) sign to add the log. At that point, I can choose Error / Warning or Informational. The script that runs information that I am interested in collecting, by the way, is an informational event.
Go to log search and do the query
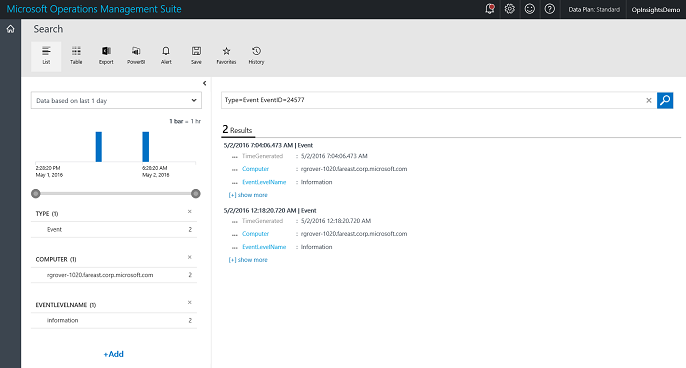
My log search query string is really simple because it is a Type=Event query and EventID 24577 returns the PowerShell script information that I want. So, I don’t need to refine by source and event level and all of that. I could, of course, but for me, that is more typing and is not needed in my early testing. This query is shown here:
Type=Event EventID=24577
The query and results are shown here:
The results show that only one user ran two scripts from a single computer. The two scripts that ran actually make sense. The first script ran around noon, and it was called Start-CloudServiceVMsCustom.ps1. Around seven hours later, a second script, Stop-CloudServiceVMsCustom.ps1, ran. That makes sense.
Pretty cool stuff. If I wanted, I could create custom fields that would extract the PowerShell script that runs. Hmmm… maybe I will give that a shot later.
That is all I have for you today. Join me tomorrow when I’ll talk about more cool stuff.
I invite you to follow me on Twitter and the Microsoft OMS Facebook site. If you want to learn more about Windows PowerShell, visit the Hey, Scripting Guy Blog. If you have any questions, send email to me at scripter@microsoft.com. I wish you a wonderful day, and I’ll see you tomorrow.
Ed Wilson
Microsoft Operations Management Team


