Monitor VMware using OMS Log Analytics
Summary: Use OMS Log Analytics to monitor VMware
NOTE: This blog post refers to a custom built (do it yourself) method to bring in VMWare monitoring information into Log Analytics. This was an interim method to help customers to gain insights into their VMWare environment until we released our dedicated VMWare monitoring solution. This VMWare solution is described in the VMWare monitoring with OMS - Public Preview blog post and the More about VMWare Monitoring Solution blog post. You should refer to those blog posts and not to this blog post for the VMWare Monitoring Solution. The techniques described in this blog post are not compatible with the VMWare Monitoring Solution.
Hello, this is Keiko Harada, and I am a Program Manager on the Microsoft Operations Management Suite team. One of the top requests from you (our customers!) is monitoring of VMware.
So here it is:
In this blog post, I will show you how to set up OMS to collect and to process the VMware (ESXi Host and vCenter) logs. As an added bonus, I will even show you some example OMS query strings that you can immediately put into production to provide deep insights into your existing VMware environment.
Set up OMS to collect data from VMware
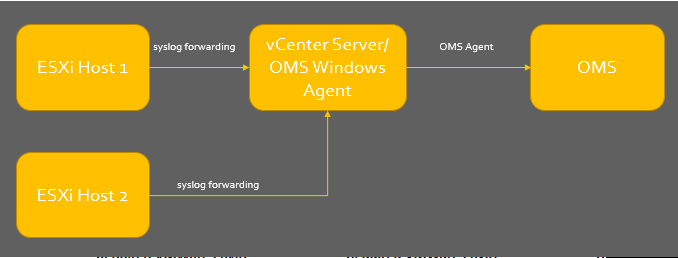
- As a first step, you set up the VMware environment so that the logs can be consolidated into a single syslog and be sent to a vCenter Server. You can have multiple ESXi Hosts forward syslog to a single vCenter server. I use the native vCenter and ESXi Host syslog capabilities. For this blog post, I’ve used the latest vCenter server and ESXi Host version 6.0. This can be done with 5.X version as well.
For detailed steps that set up syslog forwarding on ESXi Host, see Configuring syslog on ESXi 5.x and 6.0 (2003322).
Next, install the OMS Windows Agent on vCenter Server. For setup instructions, see Connect Windows computers to Log Analytics.
- After you install the OMS Windows Agent, you set up the OMS custom logs so that syslog will be collected. For details about how to set up custom logs, see Custom logs in Log Analytics.
Set up the following syslog file as your custom log on the vCenter Server. “C:\ProgramData\VMware\vCenterServer\data\vmsyslogcollector\ yourESXihostname \syslog.txt”.
For this example, I created an OMS custom log named "VMware_CL" for ESXiHost1 syslog.
- After setup is finished, go to the OMS Settings page, and see whether your vCenter server is on-boarded.
- Next, set up the OMS Custom field for certain records. For customer field instructions, see Custom fields in Log Analytics.
| VMwareHost_CF | ESXi Hostname |
| VMwarePN_CF | VMware Application Name ( vmkernel, vmkwarning, vobd, hostd, etc.) |
After you have competed the setup, you should be able to run a simple query against the syslog.
Example query strings
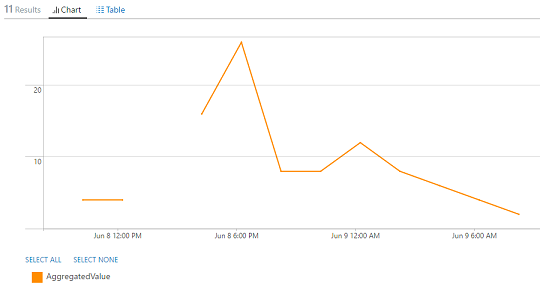
In day-to-day operations, you would like to understand the events that are happening in your environment. Here, I added some queries that can provide you with top 10 VMware events and trends, disk warning trends, VM creation/deletion counts, storage latency, etc. You can reuse these queries for other query use cases as well.
These queries can be charted and placed on an OMS dashboard. For details about “My Dashboard”, see Create a custom dashboard in Log Analytics.
Top 10 VMware event counts
| Top 10 Event charting | Type=VMware_CL | measure count() by VMwarePN_CF | top 10 |
Trend of the event counts
| Event Trend Hourly Interval | Type=VMware_CL | measure countdistinct(TimeGenerated) by VMwareHost_CF Interval 1HOUR |
Disk warning seen on a certain ESXi host within certain interval
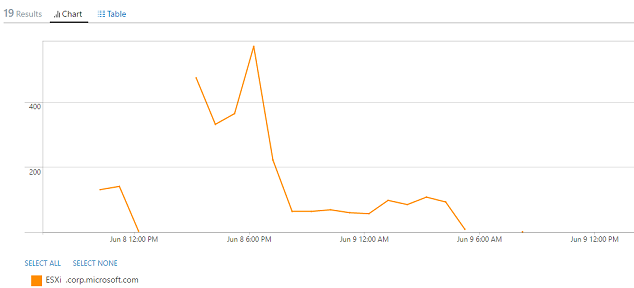
| Hourly Interval Charting | Type=VMware_CL VMwareHost_CF="yourESXihostname " VMwarePN_CF=smartd "warn" | measure count() interval 1HOUR |
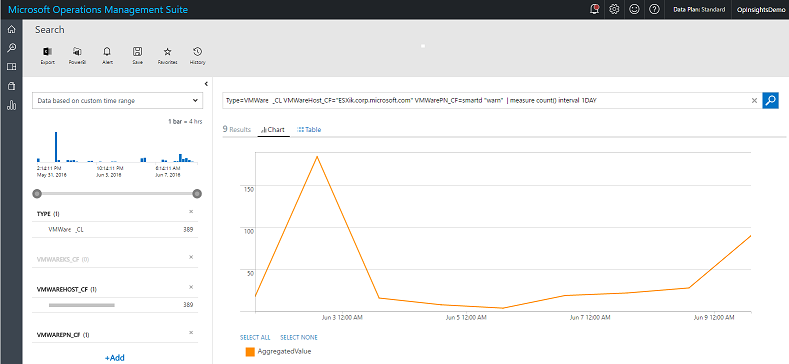
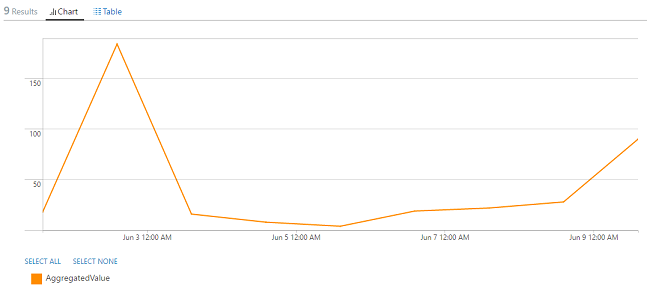
| Daily Interval Charting | Type=VMware_CL VMwareHost_CF="yourESXihostname " VMwarePN_CF=smartd "warn" | measure count() interval 1DAY |
Disk temperature warning count chart
| Hourly Interval disk temperature on ESXi above threshold | Type=VMware_CL VMwareHost_CF="yourESXihostname" VMwarePN_CF=smartd ("warn" and "above temperature") | measure count() interval 1HOUR |
VMs powered off counts per ESXi Host in last 24 hours
| Daily Interval Chart | Type=VMware_CL ("is powered off") VMwarePN_CF=Hostd TimeGenerated:[NOW-1DAY..NOW] | measure count () by VMwareHost_CF |
Count of created VMs in last 24 hours
| Daily Interval Chart | Type=VMware_CL ("Created virtual machine") TimeGenerated:[NOW-1DAY..NOW] | measure countdistinct(TimeGenerated) by VMwareHost_CF |
Count of deleted VMs in last 24 hours
| Daily Interval Chart | Type=VMware_CL VMwarePN_CF=Hostd ("removed") TimeGenerated:[NOW-1DAY..NOW] | measure countdistinct(TimeGenerated) by VMwareHost_CF |
Storage latency warning per ESXi Host in last 24 hours
| Daily Interval Chart | Type=VMware_CL ("latency") TimeGenerated:[NOW-1DAY..NOW] | measure count() by VMwareHost_CF |
Example alerting
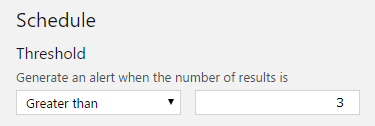
OMS has an alerting capability that uses search query results. Within the OMS alert rule UI, you can set a time window for when the search query should run and place a threshold to generate alerts. The following query will not have the threshold counts. For more information about how to set up alerting, see Alerts in Log Analytics.
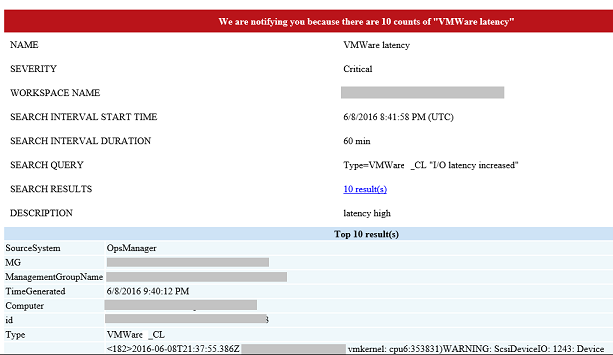
As a default. I would recommend setting the threshold to 3. After you set up the alerting on OMS, you see an email notification.
Here are some example queries that you can set for problem alerting.
Alerting on multiple VM powered off in a certain time interval
| Alerting Multiple VM powered off | Type=VMware_CL ("is powered off") VMwareHost_CF="yourESXihostname" |
Alerting on storage temperature high
| Alert on the high temperature query | Type=VMware_CL VMwarePN_CF=smartd ("warn" and "above temperature") |
Alerting on disk warning
| Disk Warning Alerting | Type=VMware_CL VMwarePN_CF=smartd "warn" |
Alerting on Storage Capacity coming close to consumption ESXi Host
| Disk Space Alerting | Type=VMware_CL ("space left on device") |
vCenter Server Shutdown
On Windows Server, vCenter Server will be logged as application event logs. OMS Windows Agent already captures the events for vCenter Server. For this query, the interval for alerting should be once every interval.
| vCenter Shutting down | EventLog=Application Source="VMware VirtualCenter Server" "shutdown" |
Get a free Microsoft Operations Management Suite (#MSOMS) subscription so that you can test the new alerting features. You can also get a free subscription for Microsoft Azure.
I invite you to follow me on Twitter and the Microsoft OMS Facebook site. If you want to learn more about Windows PowerShell, visit the Hey, Scripting Guy Blog. If you have any questions, send email to me at scripter@microsoft.com or provide your suggestion at OMS UserVoice. I wish you a wonderful day, and I’ll see you tomorrow.
Keiko Harada
Microsoft Operations Management Team
Comments
- Anonymous
June 18, 2016
Hello,Is there any chance to monitoring in OMS --> Vmware Environment by Operations Manager for Vmware?BR/Lukas- Anonymous
June 20, 2016
Hello Luki, at this moment, we do not have OMS monitor with Operations Manager for VMware. Please add your suggestion to the OMS UserVoice so we can track and review your suggestion. Again thank you for the comment.- Anonymous
June 24, 2016
Thx for reply.
- Anonymous
- Anonymous
- Anonymous
June 22, 2016
The comment has been removed - Anonymous
October 06, 2016
The comment has been removed- Anonymous
October 26, 2016
Hi Jayme, I am not sure whether you saw the blog https://blogs.technet.microsoft.com/msoms/2016/09/26/vmware-monitoring-with-oms-public-preview/. Are you doing this? Also if you can provide more detail, please send email to OMSVMWare@microsoft.com. This is just a DIY blog and I created a new one with you will need 1.2.0-75 omsagent installed to enable the VMware Solution. This blog and VMware Solution released in September is does not work together. regards,
- Anonymous
- Anonymous
October 11, 2016
Hi, i've installed MMA on Linux server which listen on 0.0.0.0:1514 with TCP to capt syslog from ESXI (no vCenter Server) and i have the error "Unknown type ‘VMware_CL’ " 9 times per day.Someone can help me ?- Anonymous
October 26, 2016
Sure we can help. Please send email to OMSVMWare@microsoft.com with your steps of what you did and what error you are seeing. Please make sure you are using 1.2.0-75 version of the omsagent. regards,
- Anonymous
- Anonymous
October 16, 2016
Do you have a solution for Linux? That would be helpful.- Anonymous
October 26, 2016
Hi Harvey, we do. We created a VMware solution which pre-populates the fields. Please refer to the blog https://blogs.technet.microsoft.com/msoms/2016/09/26/vmware-monitoring-with-oms-public-preview/. Please check that out and try it. Thanks!!
- Anonymous
