Performance Troubleshooting using the PAL tool
If you have had Exchange performance issues in the past, you must know by now that there are a lot of variables that affect Exchange overall performance and sometimes took a long time to find root cause of those problems as they can get quite complex.
If you are looking for some more detailed reports with some added charting capabilities, there is the Performance Analyzer Tool or PAL that you can grab from https://www.codeplex.com/PAL .
PAL is an extremely useful and powerful tool for automatically generating HTML reports that were collected from a performance monitor counter log. This tool uses a subset of dependencies such as Log Parser and the Office Web Components to create these reports.
PAL uses XML configuration files that parse the most important counters for Exchange performance issues and throws alerts when thresholds are exceeded for those counters. All that is needed is a blg file that was previously collected. This is not a replacement for standard performance analysis, but helps with automating some of the common tasks that are performed when troubleshooting performance issues for Exchange. With the amount of perf analysis that I do, I need a way to automate a lot of this to help give me the 30,000 foot view of how an Exchange server is performing.
With the release of the Exchange 2007 Performance Counters and their associated thresholds at https://go.microsoft.com/fwlink/?LinkId=122254, PAL consumes all of those counters and creates some nice reports for you. PAL also uses the counters in the Exchange 2003 Performance Troubleshooting white paper at https://technet.microsoft.com/en-us/library/aa997270.aspx, so no matter what type server you have, you should have reporting capabilities for each.
Let’s take a look at what kind of reports this creates.
After PAL has analyzed a blg file, an Internet Explorer Window will open with the analysis. As you can see below, there is a listing of counters that were parsed and checked for any over specific thresholds as set in the Exchange XML file. At the end of each counter, there is an Alerts part that tells you that if any of the samplings were over a specified threshold. If there was one, that value is incremented by one.
PAL Sample report
So if we look further down the list, we can see that the RPC Averaged Latency threshold was hit 6 times as shown circled in red below.
Clicking on that counter brings you to the chart for this counter. This shows a rather large spike in overall RPC Averaged Latency for that specific time.
Scrolling downward in this report now shows the thresholds that were hit for a specific time and their associated values.
As you can see, we hit a critical threshold for RPC latency that could be affecting overall client performance. This is merely a symptom of the underlying problem which could be disk latencies, LDAP Latencies, High CPU, etc., but at least the data that you would normally look at would be at your fingertips. Clicking the “Back to the top” link under each counter section will get you back to the Counter list at the beginning of the report. This allows for very quick counter analysis to see which counters could be affecting overall server performance.
The great thing about the PAL tool is that you can customize the XML files to your liking, so if you need to add/remove a specific counter and its associated threshold, you can do this very easily. For the threshold creation, if you know vbscript enough to create If/Then/Else statements, then you can customize this tool very easily to generate any report and threshold.
If you would like to see a complete sample report for a general system overview, go to https://www.codeplex.com/PAL/Release/ProjectReleases.aspx?ReleaseId=11105 and then click on the PAL Sample Report.mht link. If you need to download and install PAL, always select the most recent version for download as the above link presents an older build.
How to launch the PAL tool
1. Ensure that the PAL tool and dependency components have been installed from https://www.codeplex.com/PAL .
2. Click Start, Run, and then PAL. This will launch the PAL wizard interface.
How to create a counter log file using PAL
Follow these steps to create a counter log .htm file once the PAL wizard has been launched. Note: This contains very specific counters instead of the full counter set that perfwiz uses, so you can choose how granular you would like to get.
Launch PAL.
Click the Threshold File Tab.
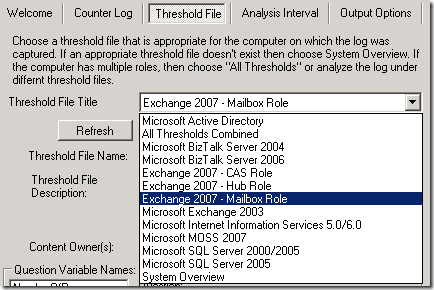
In the Threshold File Title drop down box, select the Threshold File Title version of your choice
Save the settings to a .htm file. Follow the steps in the Exchange 2007 Perfwiz replacement steps at https://blogs.technet.com/mikelag/archive/2008/05/02/perfwiz-replacement-for-exchange-2007.aspx starting at step 4 to import this .htm file in to Performance monitor.
Note: This export feature only works on Windows 2003 servers since the ability to import htm files in Windows 2008 has changed. I will post an update on how to do this on Windows 2008 servers at a later time.
How to run the PAL wizard
Launch PAL. This will bring you to the Welcome Screen. Click Next
On the Counter Log tab, select a blg file of your choice. Click Next
Select the appropriate threshold file
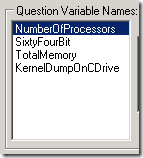
Answer any questions that are listed on that page. The answers to these questions are required so that during the processing of each performance file, we consume this information and pass this in to the tool for proper calculations. Click Next once finished.
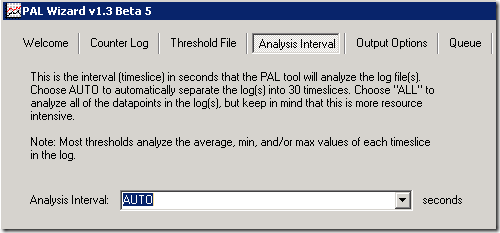
On the Analysis Interval tab, select the interval that you would like to use. Note: The default of AUTO is recommended as that is the best performance option for running the tool. Any changes to this setting could cause the report generation process to be that much slower, but will allow you to get a little more granular if needed.
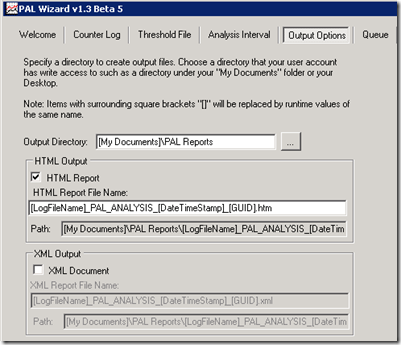
On the Output Options tab, you can select an Output Directory to store the PAL reports and what format you would like to use. Click Next once you have made your selections.
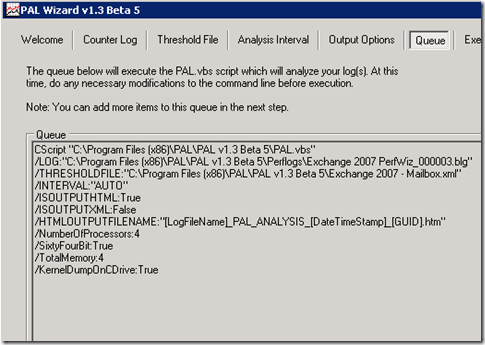
On the Queue tab, you will notice the parameters that will be passed in to the PAL tool for processing. Click Next if this satisfies your needs.
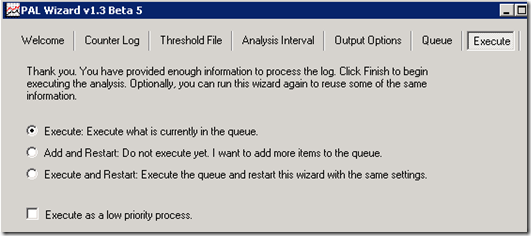
On the Execute tab, you can execute what you have just added to the queue or you could add more items to the queue for processing.
This is a resource intensive application while these perfmon files are being parsed, so I would recommend using your fastest machine to run these reports on. Once PAL has completed processing the queued items, an IE window will open for each report in the queue.
I hope you have found this information useful and if you should have any questions regarding the tools usage, any possible problems that you may run in to or just suggestions to improve the tool, you can email paltool@microsoft.com
Happy reporting!!!
Mike
Additional Resources
For the latest XML updates that are not included with the current released version of the PAL tool, see https://blogs.technet.com/mikelag/archive/2008/08/20/xml-updates-for-the-pal-tool.aspx.
Comments
Anonymous
January 01, 2003
will xml for ocs and isa available soon?Anonymous
January 01, 2003
With all the moving bells and whistles of Exchange 2007 and the amount of dependencies that ExchangeAnonymous
January 01, 2003
With all the moving bells and whistles of Exchange 2007 and the amount of dependencies that ExchangeAnonymous
January 01, 2003
The comment has been removedAnonymous
March 22, 2011
Hi Mike, Any idea whether there are any SharePoint Foundation & Server 2010 plug-in's on the horizon?


