FSharpChart new features and code drop availability
If you have been using FSharpChart you will undoubtedly have read Keith Battocchi’s posting, on the F# team blog, covering Getting Started with FSharpChart. If not it is well worth a quick read. The FSharpChart library contains F#-friendly wrappers for the types in the System.Windows.Forms.DataVisualization.Charting namespace, making it easy to interactively chart data from F#.
What you may not know is that a new version of the code has been made available. To download the new code click here.
This post covers some of the new features. So what new features have been added?
- Clipboard and SaveAs capabilities
- Property change Events
- Support for 3D Charts
- Naming of the data series for BoxPlot charts
Clipboard and SaveAs Capabilities
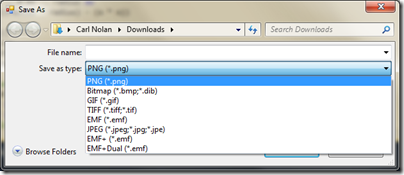
The Copy Image To Clipboard and Save Image As features have been extended. The Copy Image To Clipboard now supports the EMF (Enhanced (Extended) Windows Metafile Format) format.
The Save Image As format now supports several formats, as shown below:
In addition programmatic support has now been added for the Copy Image To and Save As features. To copy a created chart to the clipboard one merely has to call CopyToClipBoard:
[ for f in 1.0 .. 0.1 .. 10.0 -> sin (f * 2.0) + cos f ]
|> FSharpChart.Line
|> FSharpChart.WithCreate
|> FSharpChart.CopyToClipboard
Similar calls can be made for CopyToClipboardEmf and SaveAs.
Property Change Events
An improvement that has been made to the new code is support for events when certain GenericChart properties are changed; including Name, Title, Margin, Legend, and all Custom properties. These events are also used internally within the code to propagate the GenericChart modifications to the bound chart.
This feature allows the following for the following code:
chart.Margin <- (2.0f, 12.0f, 2.0f, 2.0f)
chart.Title <- Helper.CreateTitle("Chart Sin/Cosine", Font = new Font("Arial", 12.0f, FontStyle.Bold))
chart.Legend <- Helper.CreateLegend(InsideArea = false, Font = new Font("Arial", 8.0f),
Alignment = StringAlignment.Center, Docking = Docking.Top)
To assist in using this feature a few helpers have been defined to create titles and legends.
3D Chart Support
As you may know the Windows Forms charting supports the rendering of charts in 3D. Support for defining GenericChart 3D properties has now been included. As an example here is a PieChart rendered with 3D enabled:
To render a chart in 3D one merely has to enable the 3D properties for the chart area, and then specify optional 3D properties:
[("A",1); ("B",2); ("C",3)]
|> FSharpChart.Pie
|> FSharpChart.WithArea.Area3DStyle(Enable3D = true, Inclination = 60)
The feature supports the full range of properties including Inclination, IsClustered, IsRightAngleAxes, LightStyle, Perspective, PointDepth, PointGapDepth, Rotation, WallWidth. To render a 3D chart one just has to set “Enable3D = true”.
BoxPlot Data Series
If you are familiar with BoxPlot charts they are a great way to visualize several series of data. However the old implementation, when rendering the data series, labelled each with the default axis labels of 1,2,3, etc. Whereas this may be desired the new version now supports the ability to provide custom labels, for each of the data series. Thus one can now create a BoxPlot chart using the following code:
FSharpChart.BoxPlot
( [ "Eggs", [| for i in 0 .. 20 -> float (rnd.Next 20) |]
"Bacon", [| for i in 0 .. 20 -> float (rnd.Next 15 + 2) |]
"Sausage", [| for i in 0 .. 20 -> float (rnd.Next 5 + 5) |]
"Beans", [| for i in 0 .. 20 -> float (rnd.Next 10 + 3) |]
"Mushroom", [| for i in 0 .. 20 -> float (rnd.Next 15 + 5) |] ],
Name = "Breakfast Food BoxPlot")
|> FSharpChart.WithMargin(1.0f, 5.0f, 1.0f, 1.0f)
|> FSharpChart.WithSeries.Style(Color = Color.SeaGreen)
|> FSharpChart.WithLegend(InsideArea = false, Font = new Font("Arial", 8.0f),
Alignment = StringAlignment.Center, Docking = Docking.Top)
The resulting chart display will look like the following:
Support has also now been added for calling SetData on an existing data series to render a new set of data. To demonstrate this here is the code to modify a displayed chart when rendered within a Windows Forms application:
let series = new MultiValue()
series.BindSeries(chartControl.ChartSeries)
series.SetData([ "Cereal", [| for i in 0 .. 20 -> float (rnd.Next 20) |]
"Yogurt", [| for i in 0 .. 20 -> float (rnd.Next 15 + 2) |]
"Toast", [| for i in 0 .. 20 -> float (rnd.Next 15 + 2) |]
"Fruit", [| for i in 0 .. 20 -> float (rnd.Next 10 + 5) |] ],
chart.ChartBinder)
The final parameter in the SetData call is a property, called ChartBinder, defined within the GenericChart. This property enables the SetData call to adjust some properties on the bound chart.
Summary
Hopefully you will find these new features useful. If you download the code you will not only get a copy of FSharpChart.fsx but also of the original source files (used to create the fsx file), plenty of samples you can run in the interactive window, and a Windows Forms sample/test application.
Here is the code drop location:
https://code.msdn.microsoft.com/FSharpChart-b59073f5
So what next?
If you have some suggestions for features you would like to see added just visit the code drop location and start a thread in the Q&A section. Also, if you have some usability suggestions such as tasks that seem overly difficult, please do the same.
To conclude I would like to thank Keith Battocchi and Tomas Petricek for their assistance in putting together this new release.
Written by Carl Nolan


