Adventures in TSQL: SQL Server Query Performance Analysis using DMVs
From the development perspective I often have to perform an analysis of a database application. More often than not this entails looking at a running system and ensuring that the application queries are behaving as expected. As such, I thought it would be worthwhile sharing some TSQL scripts that I have been using over the years for tuning SQL Server queries. So what I am generally looking for are:
- Long Running Queries – which queries are taking the longest to run
- CPU Intensive Queries – which queries are consuming the most CPU per execution
- Worst Case Total CPU – which queries are consuming the most CPU across all executions
- Most IO Intensive Queries – which queries consume the most read/write operations
The idea behind looking at these queries is to analyse the execution plan and review whether the query would benefit from being refactored or whether there are indexes that would enable the query to perform better.
The basis of this analysis are some queries based on the SQL Server Dynamic Management Views (DMVs). For performing CPU based analysis, I have been using the following DMV based query:
CPU Query
-- Which Queries are taking the most time/cpu to execute
SELECT TOP 20
total_worker_time, total_elapsed_time,
total_worker_time/execution_count AS avg_cpu_cost, execution_count,
(SELECT DB_NAME(dbid) + ISNULL('..' + OBJECT_NAME(objectid), '')
FROM sys.dm_exec_sql_text([sql_handle])) AS query_database,
(SELECT SUBSTRING(est.[text], statement_start_offset/2 + 1,
(CASE WHEN statement_end_offset = -1
THEN LEN(CONVERT(nvarchar(max), est.[text])) * 2
ELSE statement_end_offset
END - statement_start_offset) / 2
)
FROM sys.dm_exec_sql_text([sql_handle]) AS est) AS query_text,
total_logical_reads/execution_count AS avg_logical_reads,
total_logical_writes/execution_count AS avg_logical_writes,
last_worker_time, min_worker_time, max_worker_time,
last_elapsed_time, min_elapsed_time, max_elapsed_time,
plan_generation_num, qp.query_plan
FROM sys.dm_exec_query_stats
OUTER APPLY sys.dm_exec_query_plan([plan_handle]) AS qp
WHERE [dbid] >= 5 AND DB_NAME(dbid) IS NOT NULL
AND (total_worker_time/execution_count) > 100
--ORDER BY avg_cpu_cost DESC;
--ORDER BY execution_count DESC;
ORDER BY total_worker_time DESC;
The basis of this query is that it shows the top 20 queries that consume the most CPU resources. The query can be modified to show queries that have consumed the most worker time or the most worker time per execution. It is also sometimes useful to see which queries have been executed the most, as you will want this to be highly performant. Just changing the ORDER BY allows one to tweak the queries one wants to analyse.
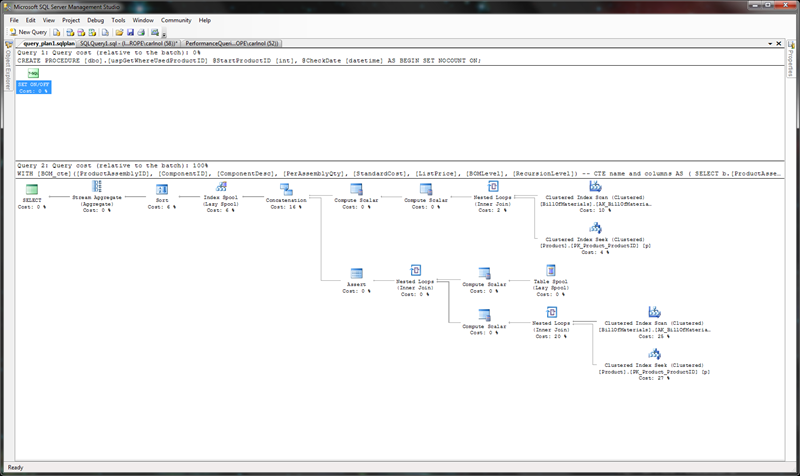
This query provides 2 critical pieces of information for query analysis. Firstly the query_text is returned so one can see what has been executed. The other critical piece of information is the actual query plan. This is returned as an XML document. Having the XML is useful in itself, however the fact one can save the XML as a file with a .sqlplan extension makes this XML invaluable.
Once the .sqlplan file has been saved, opening this file in SQL Server Enterprise Manager provides one with a graphical interpretation of the executed query. This enables one to easily analyse the actual query execution plan.
The other useful, but similar query, is the one to analyse IO based metrics:
Disk IO Query
SELECT TOP 20
total_logical_reads/execution_count AS avg_logical_reads,
total_logical_writes/execution_count AS avg_logical_writes,
total_worker_time/execution_count AS avg_cpu_cost, execution_count,
total_worker_time, total_logical_reads, total_logical_writes,
(SELECT DB_NAME(dbid) + ISNULL('..' + OBJECT_NAME(objectid), '')
FROM sys.dm_exec_sql_text([sql_handle])) AS query_database,
(SELECT SUBSTRING(est.[text], statement_start_offset/2 + 1,
(CASE WHEN statement_end_offset = -1
THEN LEN(CONVERT(nvarchar(max), est.[text])) * 2
ELSE statement_end_offset
END - statement_start_offset
) / 2)
FROM sys.dm_exec_sql_text(sql_handle) AS est) AS query_text,
last_logical_reads, min_logical_reads, max_logical_reads,
last_logical_writes, min_logical_writes, max_logical_writes,
total_physical_reads, last_physical_reads, min_physical_reads, max_physical_reads,
(total_logical_reads + (total_logical_writes * 5))/execution_count AS io_weighting,
plan_generation_num, qp.query_plan
FROM sys.dm_exec_query_stats
OUTER APPLY sys.dm_exec_query_plan([plan_handle]) AS qp
WHERE [dbid] >= 5 AND DB_NAME(dbid) IS NOT NULL
and (total_worker_time/execution_count) > 100
ORDER BY io_weighting DESC;
--ORDER BY avg_logical_reads DESC;
--ORDER BY avg_logical_writes DESC;
--ORDER BY avg_cpu_cost DESC;
Once again one can tweak the ORDER BY to analyse queries which consume the most read or write operations. For performing a quick IO based query analysis I have found it useful to calculate the total query IO based on a weighting of reads to writes; weighted IO = (writes * weighting) + reads. In this case I have provided a weighting that assumes a read is 5 times more expensive than a write.
Hope you find these DMV based queries useful, as they have held me in good stead over the years.
Written by Carl Nolan
