Using Stream Analytics with Event Hubs
This post will show you how to use the new Stream Analytics service with Azure Event Hubs to process streaming event data in near real time.
Background
Stream Analytics is a new service that enables near real time complex event processing over streaming data. Combining Stream Analytics with Azure Event Hubs enables near real time processing of millions of events per second. This enables you to do things such as augment stream data with reference data and output to storage (or even output to another Azure Event Hub for additional processing).
This post is a demonstration using the walkthrough document Get started using Azure Stream Analytics.
The scenario we will use in this post builds upon previous posts that I have written so far:
| Event Source | |
| Collect | (this post) |
| Filter / Analyze / Aggregate | |
| Event Sink | (this post) |
The data each device sends to the Event Hub is a simple JSON message.
Metric Event
- {'DeviceId':2,'Temperature':72}
We are simulating potentially millions of devices sending telemetry data indicating the device ID and a temperature. The data is sent to an Event Hub, and processed in parallel by 3 different processes:
This is incredibly powerful. Instead of chaining processes together, making one process wait on the completion of a previous process, we can scale our solution by having many independent processors work with the data in parallel.
This post is focuses on using Stream Analytics to process streaming event data from Azure Event Hubs at scale. Where previous posts showed a lot of code, this post will show how to process the Event Hub data with zero code.
Setting Things Up
Before we start using Stream Analytics, we will need an Event Hub, something that sends data to the Event Hub, and we need a database to store the data in. Creating the Event Hub is very easy using the Azure Management Portal.
Provide a name and region and a namespace (creating one if you haven’t already).
Provide a partition count and message retention period (8 is the default, 16 is recommended, 32 max).
Now we need a database to store the data in.
Provide the database name, region, and server.
Provide login details.
Once created, we can manage the database. I choose to use Visual Studio’s integrated capabilities.
We are prompted to set a firewall rule to allow the local computer to access it.
Provide login credentials, then right-click on the database node and choose New Query.
Our query will create two tables.
Code Snippet
- CREATE TABLE [dbo].[PassthroughReadings] (
- [DeviceId] BIGINT NULL,
- [Temperature] BIGINTNULL
- );
- GO
- CREATE CLUSTERED INDEX [PassthroughReadings]
- ON [dbo].[PassthroughReadings]([DeviceId] ASC);
- GO
- CREATE TABLE [dbo].[AvgReadings] (
- [WinStartTime] DATETIME2 (6) NULL,
- [WinEndTime] DATETIME2 (6) NULL,
- [DeviceId] BIGINT NULL,
- [AvgTemperature] FLOAT (53)NULL,
- [EventCount] BIGINT null
- );
- GO
- CREATE CLUSTERED INDEX [AvgReadings]
- ON [dbo].[AvgReadings]([DeviceId] ASC);
We now have two tables that are ready to receive output from our Stream Analytics jobs.
Using Stream Analytics
The Stream Analytics service is still in preview at the time of this writing. You’ll need to sign up for the preview at the Preview Features page.
Once provisioned, create a new Stream Analytics job named DeviceTemperature.
Once created, the Quick Start page lists the operations in order:
We start by adding an input. The input for this job will be a stream of data from Event Hubs.
The next page asks for an input alias (this is important as we’ll use this name in our SQL query in just a moment). You also provide the information for the existing Event Hub. Note that I have used an existing policy called “Manage” because our Stream Analytics job requires Manage permission for the Event Hub. Creating a policy for the Event Hub is simple, although not shown here.
Finally, our data is serialized as UTF-8 encoded JSON.
Stream Analytics will then make sure it can connect to the source.
The next step in the checklist is to create a query. We will create a simple passthrough query to select from our input. It’s important to note that the entity we select from, EventHubInput, is the name of the input alias used in the previous step.
Finally, we can create an output that sends data to our new SQL Database table, PassthroughReadings.
Once the job is created, click Start. You are prompted when to start the job output.
After a few minutes, your job is now in the Processing state. Start up the device simulator (a sample is shown in the post Device Simulator for Event Hubs). I simulate 1000 devices, 10 messages, no wait time, and to run only once.
Now go to the SQL database table “PassthroughReadings” and see that there are 10 rows in there now!
Doing Some Analytics
While passing data through to persistent storage is interesting, it would be far more interesting to do something with the data that would be otherwise difficult. Let’s calculate the average temperature over a 5 second span. Instead of editing the existing job, let’s create a new job called DeviceTemperatureTumbling.
Again we use the Event Hub as input, naming it EventHubInput.
This time our query will be a bit more sophisticated. Stream Analytics introduces extensions that make it easy to process time series data, something that would be quite difficult in a relational scheme.
Code Snippet
- SELECT
- DateAdd(second,-5,System.TimeStamp) as WinStartTime,
- system.TimeStamp as WinEndTime,
- DeviceId,
- Avg(Temperature) as AvgTemperature,
- Count(*) as EventCount
- FROM EventHubInput
- GROUP BY TumblingWindow(second, 5), DeviceId
Our output this time is the AvgReadings table.
We start the new job, and then run our device simulator again to send messages to the Event Hub. This time, instead of running just once, we’ll simulate 20 devices, send 10 messages at a time, run 1000 times, with no pause between iterations.
sender devicereadings 20 10 16 0 1000
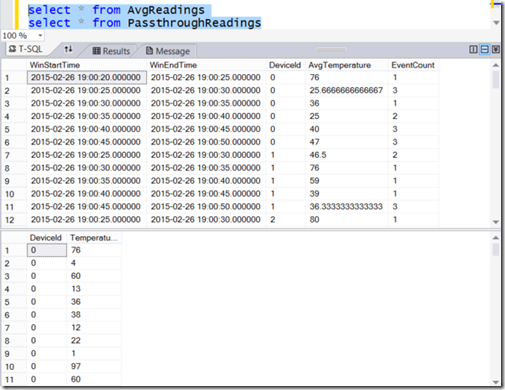
If we look at the SQL output for the PassthroughReadings table, we can see that there is a lot more data now per device, and we have multiple readings per device. The PassthroughReadings table doesn’t have any notion of time, it’s just raw output data. The AvgReadings table, however, has been augmented with the system time and a tumbling average of temperature within a 5 second window.
OK, that’s very cool… we can get an average temperature for a 5-second window. Let’s see what that looks like when we point Excel at it.
Self-Service BI
OK, now that we have data in Azure SQL Database, we can use familiar tools for self-service business intelligence. In Excel, go to the Data tab and choose From Other Sources / SQL Server.
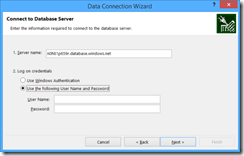
Provide the server name (something.database.windows.net) and your login credentials that you used when you created the database.
Choose the database and AvgReadings table:
I choose to create a Pivot Chart.
I use the recommended charts, and choose a line with points.
Or we might choose a radar chart.
The very cool thing about this is that once the data is in Event Hubs, we are able to process it, augment it, analyze it, and store in long-term storage, even report on the data… all this with zero code.
For More Information
Get started using Azure Stream Analytics
Use JMS and Azure Event Hubs with Eclipse
Device Simulator for Event Hubs
Scaling Azure Event Hubs Processing with Worker Roles
Comments
- Anonymous
June 02, 2016
Would be great to see some examples like this where the actual sensor Timestamp was used instead of Azure system time. Creating new timestamps for real-world machine events that are entirely dissociated with the actual event is simply not realistic. This is a shortcut that nearly all of these "Real time streaming" Azure examples are using and it both greatly simplifies and masks the challenges with using the TIMESTAMP BY feature in SA. My goal in bringing this up is that I have yet to find Tumbling WIndow output from SA make ANY sense if I am using Timestamp by. I commonly see sensor data landing in buckets as much as 2 minutes distant from the real event time - despite knowing it entered the underlying event hub within 10 seconds of creation. - Anonymous
July 13, 2016
The comment has been removed - Anonymous
September 13, 2016
The Device Simulator for this asks for the storage name and key, where as the example above has the sql database.I am not able to run simulator as it needs the storage name and keys .


