Can’t hit breakpoints in a plug-in or can’t debug .NET 2.0/3.0/3.5 from a mixed mode .exe project with Visual Studio 2010?
With Visual Studio 2010 came the release of Visual Studio .NET 4.0. .NET 4.0 adds a lot of great features and new capabilities; however with .NET 4.0 came a new 4.0 debug engine in Visual Studio 2010 (so there are now two managed debug engines, 2.0/3.0/3.5 and 4.0). Ordinarily if you are developing/debugging your managed application inside of Visual Studio and begin debugging (F5) Visual Studio knows which engine to use. Likewise if you are attaching to a process, Visual Studio is able to tell which version of the .NET Runtime you are running on and attaches with the appropriate managed engine.
There are two scenarios however that people have been encountering since Visual Studio 2010 released where Visual Studio cannot correctly determine which engine to attach with, and therefore uses the default of 4.0 leaving 2.0/3.0/3.5 applications “un-debuggable”; (1) developing a class library plug-in for a third party application (Excel, Work, AutoCAD, etc), and (2) interop debugging when launching a native .exe project. In both cases the symptoms will be the same, you will be unable to hit breakpoints in your managed code (they will be hollow with a message that “No symbols have been loaded for this document”) as well as being unable to step into the managed code.
As I explained above, the cause of this is the managed application is 3.5 or previous, and the debugger is attached with the 4.0 engine. The best workaround is to add a <supportedRuntime> tag to your application’s *.exe.config file. For example, if I am debugging the application foo.exe I would edit (or create if necessary) the foo.exe.config file in the same directory as foo.exe. I would then add the <supportedRuntime> tag with the correct version of the .NET runtime in the <startup> section as shown in the example below. This will let Visual Studio know which version of the .NET runtime you will be running (so if you are developing a class library plug-in for Excel, you would add the <supportedRuntime> tag to the excel.exe.config file).
<!-- sample foo.exe.config -->
<?xml version ="1.0"?>
<configuration>
<startup>
<supportedRuntime version="v2.0.[version on your machine]" />
</startup>
</configuration>
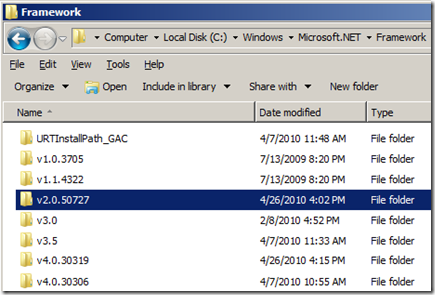
To determine the correct [version on your machine] look in the “C:\Windows\Microsoft.NET\Framework” directory for the most recent “v2.0.xxxxx” folder.
Comments
Anonymous
June 01, 2010
Does this solution work for x64 machines as well? (Windows 7 Enterprise x64)Anonymous
June 09, 2010
Yes, this works on x64 machines as wellAnonymous
June 14, 2010
Is Microsoft planning to fix it?Anonymous
January 19, 2011
It doesn't work for me! I also develop third party .Net 2.0 plugins for an application. My breakpoints are not marked with a warning sign (to warn about that the breakpoint "will not currently be hit"), but they are still not hit. I get two warnings: "Could not find schema information for the attribute 'supportedruntime'" "Could not find schema information for the attribute 'version'"Anonymous
February 16, 2011
in my Case the breakpoints are reachable, but attaching to the reportingservices service prevents it from running, so it does nothingAnonymous
March 02, 2011
I've had this work for me on some systems and not work on others (MMC application on Win7 x64). After burning many hours trying to figure it out I have given up and attach to the MMC process from the debugger. It would be nice if the debugger could figure this out on its own.Anonymous
October 20, 2011
In my case I have this issue, but I solved using another approach: readding tags I have deleted from caller assembly´s web.config. I readded configSections tag, system.web, compilation, etc.

