Sample Reports for Operations Manager 2007 R2
Often I get asked from different customer how to develop specific reports in OpsMgr. The data stored in data warehouse contain more information than you might be aware of.
I'll provide some of them as example to the community.
- Report: Agent with specific average performance values
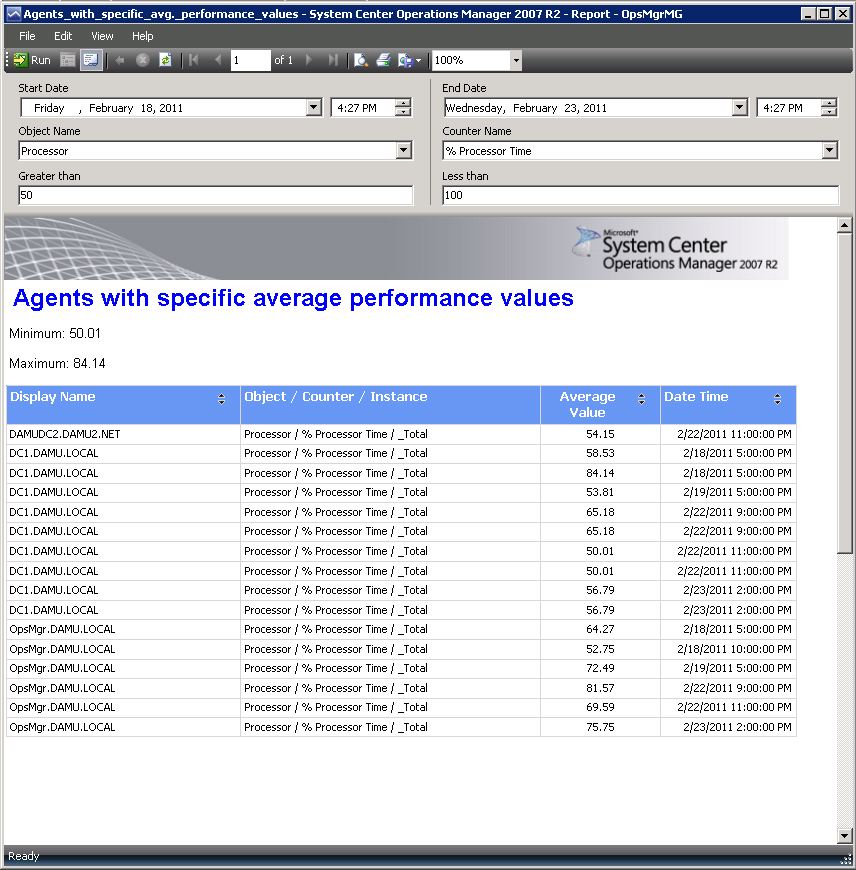
The reason of this report is to identify agents with performance values within a specific range in a given time range.
e.g. Your manager requests some data about most busy servers. He proactively wants to know which server has an average processor utilisation above 50% processor time. Normally such servers will not generate any alerts at this utilisation level.
If you're managing several hundreds of servers you can't easily find those servers unless they fire alerts in Operations Manager.
Using this report you will be able to find every agent with avg. values of a specific counter in given time range.
- Report: Performance Counter Listing
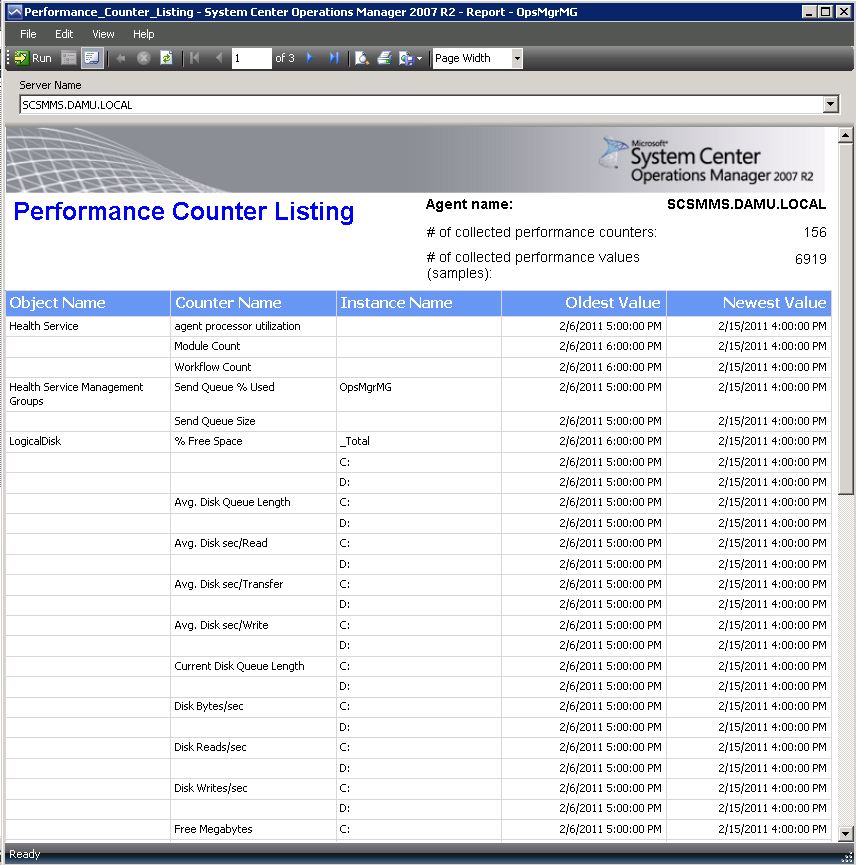
Sometime you're wondering which performance counter are collected on your servers and which counters are stored in data warehouse.
It's not easy to identify all of them because some counters might only be stored in operational database and not in data warehouse database (depending on the collection workflow).
Using this report can help you and your colleagues to see all collected counters and the time range those values are available.

Report: Easy History Report
It can be confusing to fill in the necessary information to the report parameter list to get the report generated as expected.
You have to consider the right class, the right collection rule and so on.Using this report can help you to generate a report without thinking about classes or rules and so on.
Just select the agents you want to reports.
The specific thing here is: The dynamic parameter list will provide you only objects and counters that are really collected on selected servers.
That means you will not see any SQL counter if no SQL Servers are selected.This might make your life a bit more easy. ;-)
How to import those reports.
Download the *.rdl files
Connect to your OpsMgr reporting instance (e.g. <servername>/reports )
Create a new folder where you store all your custom reports (clicking "New Folder") and upload the report (clicking "Upload File")
OR just upload the report by clicking "Upload File"
Select the report you want to upload to your reporting instance.
Once you uploaded the report you need to assign your "Data Warehouse Main" data source.
Click on the uploaded report, click on Properties, click on Data Sources , browse for your "Data Warehouse Main" shared data source click "OK" and don't forget on the next page to click "Apply"Now you can run the report as usual in your OpsMgr Console.
Have fun! ;-)
Comments
Anonymous
January 01, 2003
Hello Jos, what's your version of SQL Reporting Service? The reports were created on BIDS 2008.Anonymous
April 21, 2011
The comment has been removedAnonymous
June 27, 2014
These are nice. Report History has a typo in Report Title field. It's Titel instead of Title. I fixed it in mine, but when you get a chance you might want to update your rdl. The performance history report, I like that, and I wonder if you could modify it so that instead of "selected servers" we could use group instances instead. That is something I am trying to author so that we can run a report on a group of Exchange servers, or WINS servers, and only pull back available counters from those instance groups vs having to know the names of the servers.


