Tip: VS2008 - Understanding Performance Targets
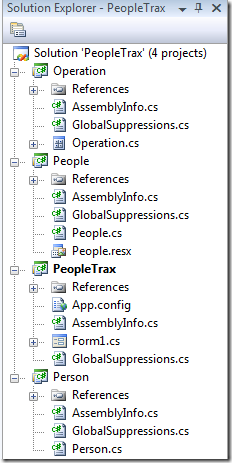
If you have a solution that contains multiple projects it is important to know what the 'Targets' group in the Performance Explorer is used for. The PeopleTrax solution shown on the right has 4 projects, with 3 of them compiling to managed DLLs and 1 compiling to an executable.
After running the Performance Wizard to create a Performance Session the Performance Explorer contains a single target as shown below.
Only the project that compiles to an executable is listed in the 'Targets' folder (for other project types like websites it would include the default launch project). What about the other 3 projects? As this tip explains, it depends upon the type of profiling you wish to do.
Sampling
With sampling there is no need to add the additional projects to your targets list. We do not modify assemblies when sampling and we will automatically attempt to collect data for any assemblies loaded by the PeopleTrax target. The only exception to this requirement is if you wish to collect data for multi-process scenarios and therefore need to launch multiple targets.
Instrumentation
For instrumentation, if you wish to collect data for the additional projects they should be added to your targets list as follows:
- In the Performance Explorer, right-click on the 'Targets' folder:

- Choose 'Add Target Project' to display a dialog:

- Select the assemblies you wish to collect Instrumentation data for and choose OK.
The selected projects will now be modified (instrumented) when you start profiling. You can selectively disable instrumentation for certain projects by right-clicking on the target and unchecking the 'Instrument' option.

Instrumentation properties for a specific target.
Comments
- Anonymous
July 23, 2008
The comment has been removed

