The Case of the Relentless Cookie Monster
Introduction
Okay, I'm finally back from my 3 weeks of vacation. We went back to Dayton, Ohio to visit family and friends and had a great time. I wasn't onsite with any customers, but inevitably I had plenty of computer problems to solve. Some people avoid helping friends and family with computer problems, but actually enjoy it. I'll do a few separate blog posts to talk about the adventures I had. In the meantime, here is a good one about my wife’s computer…
My wife wanted to have her genealogy data with her while visiting in Ohio, so I decided reload my spare laptop for her to use. I've been trying to get her to go to Windows 7 for awhile now, so this was a great opportunity to get her to try it out. In any case, getting my wife to go to Windows 7 is not what this blog post is about.
Relevant Technical Data
Operating System: Windows XP Professional 32-bit
RAM: 2GBs
Hard Drives: 1 drive (C:)
The Problem/Symptoms
Before I started the migration Wizard on my wife's desktop computer (Windows XP) to copy her files and settings to her new laptop, I noticed that her desktop system was running very slow. "Slow" as in web sites are taking about 30 seconds or more to come up and overall system performance seemed sluggish such as the Start menu taking about 10 seconds to come up.
Troubleshooting
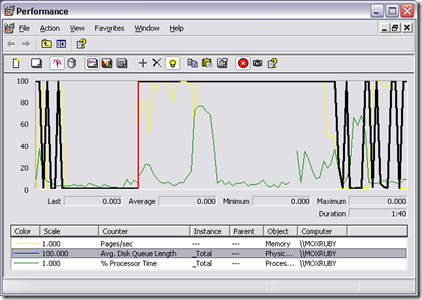
I fired up Task Manager (Ctrl+Shift+Esc) to see if there is any CPU or memory related issues. In this case, CPU utilization was relatively low (less than 10%) and memory availability looks good (less than 10% committed memory usage). Finally, using Microsoft Performance Monitor I looked at disk I/O. Bingo! Disk response times are very high and the average disk queue length is high.
It is a bit difficult to see in the screenshot above, but Avg. Disk Queue Length is above 1 for a long time. When there is more than 2 I/O’s waiting on a disk spindle for a long period of time, then that is an initial indicator of a disk problem. Be careful about using the _Total instance because it will average out this value across all of the disks. In this case, my wife only has one hard drive on her computer, so I can safely say that the disk resource is the busiest resource.
As a general rule of thumb, you can use Avg. Disk Queue Length as an initial indicator when there is more I/O on average than 2 plus then number of spindles. This means that if this was a RAID0 with 5 spindles (spindles = physical disks behind the RAID), then an Avg. Disk Queue Length greater than 7 on average would be considered bad. In any case, the best performance counters to use as initial disk performance indicators is Avg. Disk Sec/Read and Avg. Disk Sec/Write. They should always be less than 15ms regardless of the disk architecture.
Great! I found disk is the problem won't my wife be proud? ;-) Well, just like my customers, my wife doesn't care if I find a busy resource - she just wants it fixed. :-) So, we can’t stop here.
To identify why the disk resource is so busy, I used one of my favorite tools called Process Monitor by Mark Russinovich. Process Monitor is a SysInternals tool which is owned by Microsoft. It can be ran directly from the internet by browsing to https://live.sysinternals.com/procmon.exe.
I ran Process Monitor and used the Process Activity Summary to tell me which process is causing the most disk I/O. To my surprise, Internet Explorer was causing the most disk I/O. I practically never see IE causing disk I/O, so this was an interesting result.
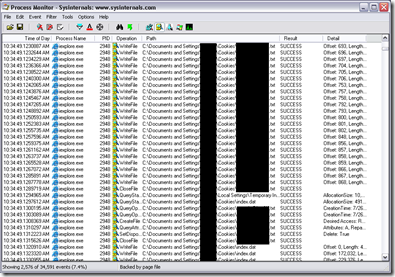
Here is a screenshot of Process Monitor showing iexplorer.exe hitting a cookie text file very hard.
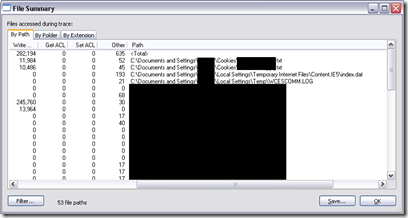
To confirm that this is the problem, Process Monitor has the ability to aggregate the results into a File Summary view or a Process Activity Summary view.
Above is the File Summary view which shows the files that had the most disk I/O. This view shows that Internet Explorer cookies are hitting the disk the most.
The Solution
The solution? I simply closed the browser tab that had the web site up. Now, you are probably thinking, "That’s too simple. Why even blog about it?". Well, the point of my blog entries like this one is to highlight the troubleshooting steps and tools that I use to solve these issues. If this was a high end SQL Server, then my troubleshooting steps would be relatively the same.
Conclusion
Microsoft Performance Monitor and Process Monitor are excellent tools to help identify performance problems on computers. Process Monitor has many other features that I have not documented in my blog yet such as network I/O, registry key access, and my favorite… call stack aggregation, but I’ll try to talk about them in the future.
Please don’t think that cookies have bad performance problems. I can honestly say that this particular issue is extremely rare and I was very surprised to find this. Cookies are normally very low, if any, overhead.
Note: I could have used Microsoft xPerf to solve this issue as well.
I hope you enjoyed this blog entry.
Thank you!
Comments
Anonymous
January 01, 2003
I blogged about a very similar problem I was having: http://dmoisan.spaces.live.com/blog/cns!95CB015E3E4A702A!1089.entry I had run xperf and found all my CPU was going into one particular function in IE that handled cookies. Turned out I had a large cookies cache that had been imported from XP to Vista and had had a lot of dead entries. I had to erase my cookies. Problem resolved.Anonymous
August 25, 2009
nice post ! when you summarize your post, could you please make a section of "used tools" and point out full name and URL for the said tools - it would help definitely. Also i couldn't find MS Performance Monitor on the web - perhaps cz. I'm a network/cisco guy - just reading your blog for the sake of improving my domain knowledge and troubleshooting thanks.Anonymous
September 04, 2009
Great suggestion. I will all a Tools Used section to my posts from now on. Thanks!Anonymous
September 04, 2009
Oh, and the MS Performance Monitor tool is built into Windows. Just go Start, Run, type "perfmon", then Enter.


