How to capture and analyze dump for intermittent High Memory on Azure Web App
Previous posts introduced how to capture dumps for intermittent Exception and High CPU issues on Azure Web App. Today Crash Diagnoser V1.3 supports High Memory dump capture too. Here are quick configure steps:
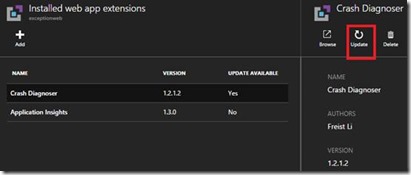
1. Install Crash Diagnoser from Site Extension Gallery. For detailed installation steps, click here. If you installed it before, can update it from Microsoft Azure Portal.
2. Open https://yourwebapp.scm.azurewebsites.net/crashdiag , click the 2nd Chance Unhandled Exception tab, choose your target process name. The default options include w3wp, node, php-cgi.
If you want to monitor other process, such as mywebjob.exe, just type the process name mywebjob manually in the field.
3. Select the Monitor Memory field as “Yes”. Set the Memory Threshold, and Memory Type (Private or Virtual). The summary info explained details.
Note: This guide simply used 2nd chance exception + Monitoring Memory scenario. Actually either 1st chance or 2nd chance Exception, CPU and Memory monitoring rules can be used at the same time.
4. Click the Start button. Will see the title status changes:
5. If the high memory issue happens, the dump will be generated and displayed in the Dump File List:
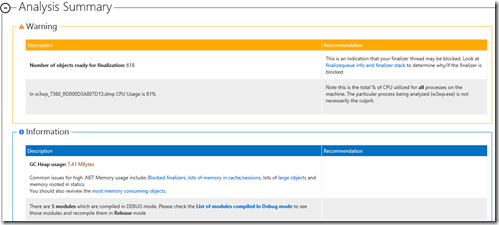
6. The cool thing is you can directly analyze the generated dump files now (for exception, high cpu, high memory, etc.) by click the Analyze button. Generally you don’t need manually download dump and perform offline analyze on them through Windbg/DebugDiag now. The analyzed report can be downloaded and viewed in the Report File List:
A report sample:
More Information Regarding Crash Diagnoser
===============================
How to capture intermittent exceptions on Azure Web APP
Troubleshoot Stack Overflow on Azure Web APP
How to capture High CPU dump on Azure Web APP
Thanks.
Freist


