Pro Tip: PowerShell DSC Events to Monitor
 The Problem
I need to monitor PowerShell DSC health on all of my nodes. But I do not want to wait for every possible event to happen in production to catch it and add it to my monitoring event list.
The Options
There are many options for monitoring PowerShell Desired State Configuration (DSC) status on your Windows nodes:
- DSC reporting server
- Get-DSCConfigurationStatus / Test-DSCConfiguration
- xDscDiagnostics
- OMS / Azure Automation DSC
- Harvest and parse the status files under C:\Windows\System32\Configuration\ConfigurationStatus\
- Event logs (which logs and events to capture?)
- Windows Event Forwarding
- Enterprise tools: Splunk, Nagios, SCOM, etc.
I am not saying any one of these options is better than the other. Some would certainly require more work.
One of the easiest options is to simply monitor the Windows event log on your DSC nodes. (While DSC is now available on other platforms, this tip is for Windows nodes. )
The Solution
Every company should already have an enterprise monitoring solution to collect server events centrally and alert on them.
This sweet little snippet below will give you a list of every possible event so that you don’t have to wait for them to happen in production to catch the ID to add to your monitoring solution.
 (Get-WinEvent -ListProvider Microsoft-Windows-DSC).Events |
    Select-Object `
        @{Name='Log'       ;Expression={$_.LogLink.LogName}},   `
        @{Name='LevelValue';Expression={$_.Level.Value}},       `
        @{Name='LevelName' ;Expression={$_.Level.DisplayName}}, `
        Id, Description, Template |
    Out-GridView -Title 'DSC Client Events'
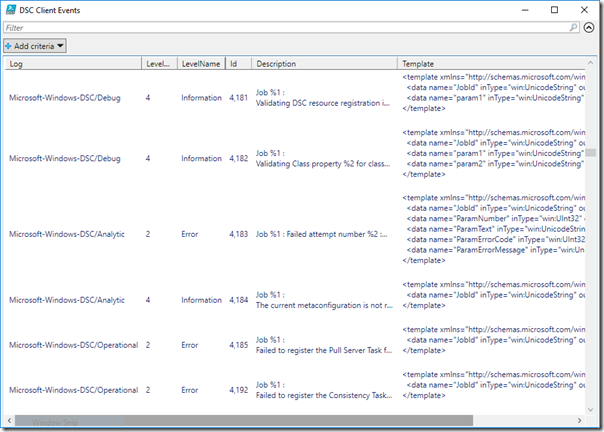
Now you can see every possible Information, Warning, and Error event for the Operational, Analytic, and Debug logs in the Microsoft-Windows-DSC provider. It also shows you what all of the place-holder values are in the error message. Here is a clipping of the output:
You could even take this list and pipe it into some code to automatically generate an event log import template file for your monitoring tool of choice.
I can’t find the Analytic and Debug logs.
By default the Analytic and Debug logs are turned off. You can enable them using either wevtutil.exe or xDscDiagnostics\Update-xDscEventLogStatus.
But wait, there’s more!
There is more than one provider for DSC event logs, especially if you are wanting to monitor pull server events as well. Use this snippet of code to list the same event information above for any possible DSC event log on your server.
 $Providers = Get-WinEvent -ListLog *DSC*, *DesiredState* -Force |
    Select-Object -Unique -ExpandProperty OwningProviderName
$DSCEvents = ForEach ($Provider in $Providers) {
    (Get-WinEvent -ListProvider $Provider).Events |
        Select-Object `
            @{Name='Log'       ;Expression={$_.LogLink.LogName}},   `
            @{Name='LevelValue';Expression={$_.Level.Value}},       `
            @{Name='LevelName' ;Expression={$_.Level.DisplayName}}, `
            Id, Description, Template
}
$DSCEvents | Out-GridView -Title 'DSC Events'
If you would like more information on how this code snippet works or how to filter out specifics of the event message fields, then go read this popular previous post (and the sequel post) that explains events, schemas, and XML in PowerShell.
Happy Hunting
Now those of us who insist on everything being complete and orderly can put our minds at ease. You now have a way to list every possible DSC event log entry and decide which ones you want to monitor. Happy hunting.
Edit 5-11-17: See this newer post with specific event IDs to monitor: https://blogs.technet.microsoft.com/ashleymcglone/2017/05/11/top-10-powershell-dsc-node-events-to-monitor
