Useful Reports in System Center Operations Manager
A lot of my customers never use the reporting feature of System Center Operations Manager. Some do not even install the reporting component, and are happy to simply drift through the river of life without knowing what’s coming around the next bend. A lot of them have the reporting component of SCOM installed, but either never use it, or think that it is only useful for technology administrators (AD, SQL, IIS, SharePoint, etc.) Well, I am here to tell you that SCOM reports CAN help the SCOM administrator, and are in fact very useful.
One of my favorite reports is the Data Volume by Management Pack. Ask yourself this question: How much do you know about exactly what is going into your Operations Manager databases? Besides alerts, what else is going inside the databases? Well, the Data Volume by Management Pack can show you this information, and more.
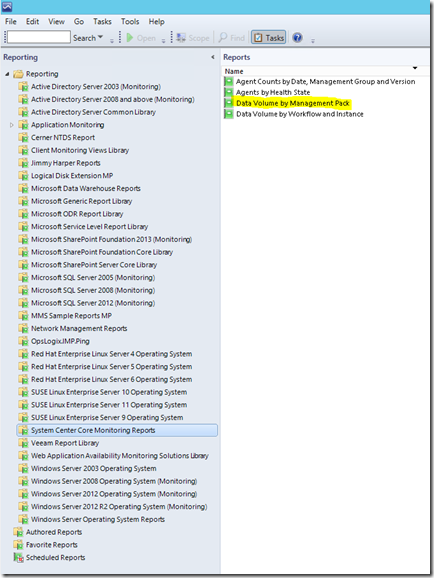
First, where do we find the Data Volume by Management Pack report? In the Reporting workspace, it can be found under the category folder called System Center Core Monitoring Reports:
This is actually one of the easiest reports to configure and run in Operations Manager. When you open the report, you get the following configuration fields:
First configure the time frame for the report. Keep in mind that the larger timeframe you configure, the longer the report will take to execute. I like to run this report on a monthly basis, so configuring a month period in the From and To fields is usually good enough for my needs. For this example I am going to use 10 days. The rest of the fields I generally leave unchanged, but you can adjust them as necessary. One thing I would like to mention, and which I find few people know is in regards to the Management Pack control on the bottom right corner of the screenshot above. In this control you can check or un-check specific management packs you wish to include or exclude from your report. By default all management packs are checked, and in fact for this report I usually leave them all checked. However, if you want to run this report for only a sub-set of management packs, you do not need to manually un-check each management pack. If you right-click on the control, you will get a context menu which allows you to check or un-check all the items in the control. This control is also available in other reports, most notably the Most Common Alerts report under the Generic Report Library, but that’s a topic for another day.
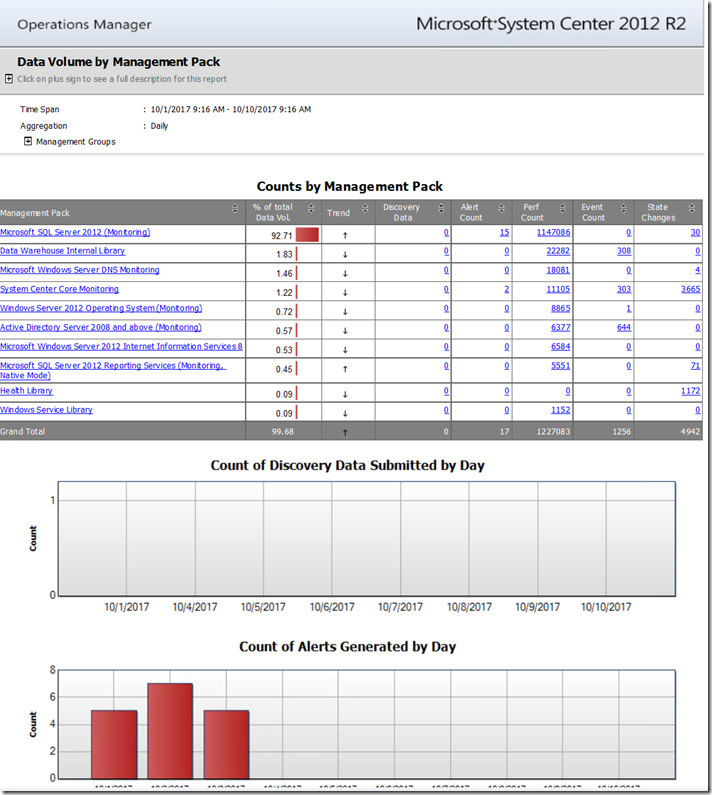
Once you have configured the report settings, and click the run button, you will get output which looks something like this (this is just the first page out of two pages of output):
You may not realize it now but this report is chuck full of useful information, so let’s take a look. The first thing I want to point out is the table at the top showing Counts by Management Pack. Notice that the first management pack listed, the Microsoft SQL Server 2012 (Monitoring) management pack accounts for 92.7% of the total volume of data being written into my databases. I don’t know about you, but to me that sounds like a lot. In your environment you may see different numbers, but in my experience, the top items in this list are typically all the SQL monitoring management packs across SQL versions. What does this tell me? Well, it tells me that if I want to do some tuning of workflows to reduce what goes into my database the SQL 2012 Monitoring management pack is probably a good place to start.
Notice the columns on the right side of the table. Discovery Data is low, in my case 0 because few (or in my case none) databases or SQL objects were discovered over the timeframe of the report. Alert Count does show some alerts, as does the State Changes column. These indicate that monitors detected problems, probably raised alerts, and hopefully my DBAs did something about them. What is far more interesting, however, is the Perf Count column. Over one million performance measurements were captured in a 10 day period in my environment. If you don’t think that is a lot, let me add this: I only have one SQL server in my lab. So from one server, in 10 days, one million SQL related performance measurements were taken. This does not include Operating System performance measurements like CPU, Disk, Memory, etc.
As it turns out the SQL management packs have a bunch of performance collection rules, which run on every SQL server, across all versions and collect a variety of SQL specific performance metrics. This is not necessarily a bad thing, if the SQL Admin team is consuming these performance metrics through reports, dashboards and/or views. However, in my experience the SQL team either does not consume any of these metrics, or consumes very few of these metrics. If only there were a way to tell exactly which SQL performance counters are being collected the most. If only we could tell which rules within the SQL 2012 Monitoring management pack are doing all of these one-million plus performance collections in my environment. Oh, wait. There is!
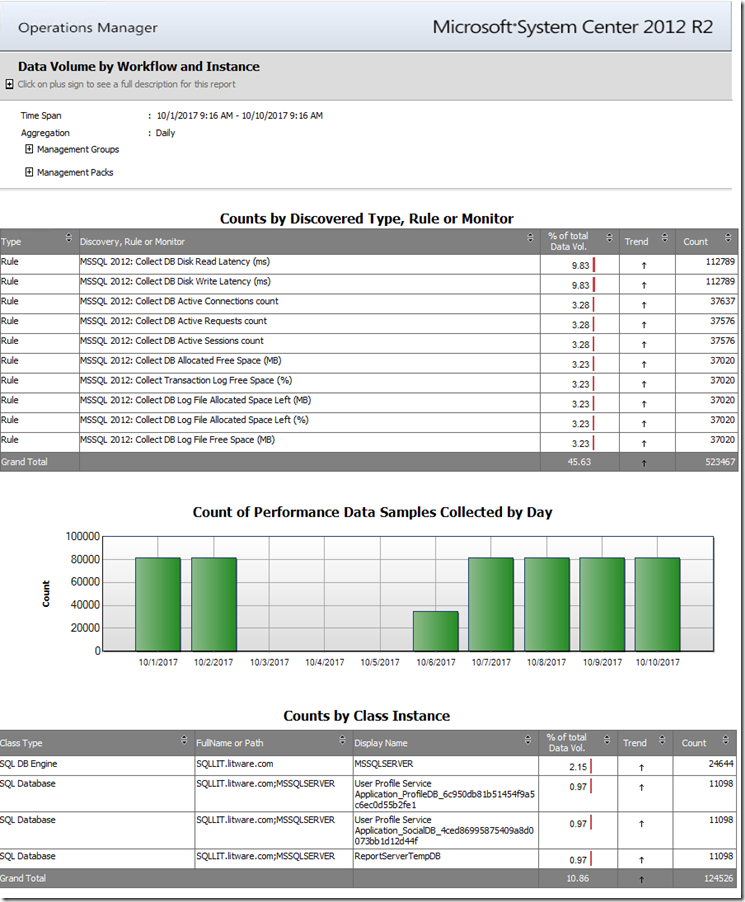
Notice that the contents of each column are the data items but in the form of links. Links which can be clicked on, and trigger the opening of what are appropriately named Linked Reports. In this case, when you click on the number (1147086) under the Perf Count column for the Microsoft SQL Server 2012 (Monitoring) row, it triggers the opening of a details report. The report it opens is actually a pre-configured version of a report called Data Volume by Workflow and Instance (preconfigured with the same settings as your original report: From date, To date, etc.) The Data Volume by Workflow and Instance report is available under the System Center Core Monitoring Reports as well. In my example it looks something like this:
Notice the Counts by Discovered Type, Rule or Monitor table at the top and how it lists the rules which are collecting the most performance data in my environment. Most of the workflows are pretty evenly distributed in how much data they collect. Again, if these data items are needed, then there is not much to do. However, now that we know what data the SQL management pack’s performance collection rules are inserting into the Operations Manager databases, I can have an honest discussion with my DBAs about what they need and don’t need. If they tell me they don’t need specific items, I can go override those performance collection rules to disable them.
I went through this exercise with one of my customers recently, and their DBAs came back with: “We don’t need any of those performance metrics from SCOM. We don’t use them, we don’t see them, we don’t need them.” It turns out they use something else to track and chart SQL performance and wanted no SQL performance collections in SCOM. My customer does want all other SQL monitoring, meaning the rules and monitors which raise alerts. They just didn’t want the performance data, so they wanted to disable all the SQL performance collection rules across all versions of SQL (2005, 2008, 2012, 2014, 2016).
NOTE: Yes, it is possible to disable just the performance rules, without disabling any monitors (even monitors which leverage the same performance metrics as rules I disable.) Performance based monitors will either have their own data source, or a shared data source with the performance rules. Disabling a rule does not disable the underlying data source so the monitors will be fine either way.
So the question then becomes, how do I disable all the performance based rules in ALL the SQL management packs across all versions and components? The answer: PowerShell, of course. I am a big believer in not reinventing the wheel if I don’t need to. Sridhar Vishwanatham wrote an excellent article on TechNet titled: SCOM 2012: Bulk Override Creation for Monitors and Rules using PowerShell. He has a script in the Rules section which almost did what I needed, so I performed a few quick modifications:
  1 import-module operationsmanager
 2
 3 $mps=Get-SCOMManagementPack |?{($_.name -match "sql") -and ($_.Sealed -eq "True")}
 4 $overrideMp= Get-SCOMManagementPack -Displayname "Litware.SQL.Customizations2.MP"
 5 $rules=$mps|Get-SCOMRule | ? {$_.Category -eq "PerformanceCollection"}
 6
 7
 8 foreach($rule in $rules)
 9 {
10     if($rule.Enabled -ne "false")
11     {
12         $Target= Get-SCOMClass -id $rule.Target.id
13         $overridname=$rule.name+".Override"
14         $override = New-Object Microsoft.EnterpriseManagement.Configuration.ManagementPackRulePropertyOverride($overrideMp,$overridname)
15         $override.Rule = $rule
16         $Override.Property = 'Enabled'
17         $override.Value = 'false'
18         $override.Context = $Target
19         $override.DisplayName = $overridname
20         $Override.Comment = "Disabling as per request from SQL DBAs on " + (Get-Date).Date
21     }
22 }
23
24 $overrideMp.Verify()
25 $overrideMp.AcceptChanges()
26
I ran the script above directly on one of my customer’s Operations Manager Management servers, and then verified the SQL performance collection rules across all SQL management pack versions were disabled. I do want to point out that in line number 4 I specify a management pack in which so store the overrides. I chose to store these overrides on a separate management pack from where I keep all my other SQL customizations, in case I want to reverse these performance collection rule overrides in bulk. If a time ever comes where the SQL team again wants to collect performance information for SQL using the SQL management packs, all I need to do is remove the management pack called “Litware.SQL.Customizations2.MP” from the SCOM management group, and performance collections will begin anew.
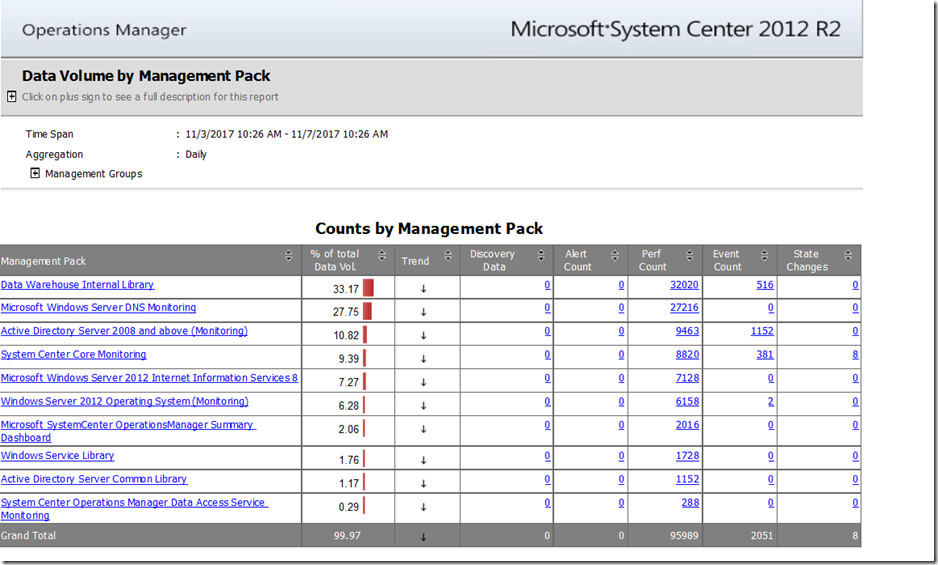
After having performed the override of all SQL performance collection rules across SQL versions, running the Data Volume by Management Pack, and configuring a timeframe of a few days AFTER the overrides went into effect, I now get a report like this:
Notice that far less data is going into my SCOM databases, and I can then choose whether I need to tune any of the workflows from the remaining management packs. It is important to note that I do not look to get rid of all data going into the SCOM databases. The objective is to have SCOM monitor the items you care about, and collect data that you care about. Collecting data which you do not need, and will never use is a waste of time and resources, so the trick is to tune SCOM to collect only what you need, and nothing else.
There is one more useful piece of information you can glean from the Data Volume by Management Pack report. Below the Counts by Management Pack table, there are some graphs, displaying information about things like:
- Count of Discovery Data Submitted by Day
- Count of Alerts Generated by Day
- Count of Performance Data Samples Collected by Day
- Count of Events Collected by Day, and
- Count of State Changes by Day.
These graphs can also be useful, albeit in a slightly different way. When I look at these graphs, I look for things which are out of the ordinary. Take a look at the following chart from the Data Volume by Management Pack report:
When I look at this graph, my immediate thought is: “what happened on 10/4/2017? Why are there so many MORE state changes on that date than in all the other dates in the timespan of the report?” Now, the graph by itself does not indicate a problem. There are any number of reasons which could explain why this happened. Maybe I had some new agents deployed that day. Maybe I imported some new management packs and had not yet tuned them. Maybe we had some sort of outage we are aware of, but were able to resolve. Maybe. But if I cannot find an answer, I may want to dig deeper and find one. I could re-run the report, but focus just on that date, then see which management pack( s) had monitors changing state a lot that day, and then leverage the Data Volume by Workflow and Instance to narrow things down to specific monitors, and object instances.
The Data Volume by Management Pack report and the Data Volume by Workflow Instance report are two handy tools in the toolbox of every great SCOM administrator, and now you too know how to leverage them.
Comments
- Anonymous
November 29, 2017
Awesome! Thanks for taking the time to post this. I had written a little something similar for bulk overrides (for myself) but your example uses a much better approach.


