Diagnostics and analytics
Designing for performance and performance testing are important parts of your Power Apps project. When conducting performance testing, try to test with a volume of data similar to your production system data volume. That will give you a good understanding of app performance, in general, and identify areas to optimize.
So how can you diagnose what's going on with your app and analyze your tests? In this unit, we'll provide a more thorough introduction to some tools that are available to help.
Monitor
Overview
Monitor, which we discussed previously, allows makers to view a stream of events from a user's session to diagnose and troubleshoot problems. You can use Monitor to either view events while building a new app in Power Apps Studio or monitor published apps during runtime.
Benefits
Monitor can help you diagnose and troubleshoot problems faster and build more reliable apps. It provides a deep view of your app by logging all the key activities that occur in the app as it runs. Monitor also provides a better understanding of how the events and formulas contained in your app work, so you can improve performance and identify any errors or problems.
Debugging an app
The key to debugging a problem is to understand what your app does and how it does it. Sometimes it's difficult to isolate a problem by just looking at the app formulas or even by reviewing runtime errors. Watching events as they occur in your app in Monitor can help you understand the order of events and how your app is performing, to spot errors and diagnose problems faster.
Monitor dashboard
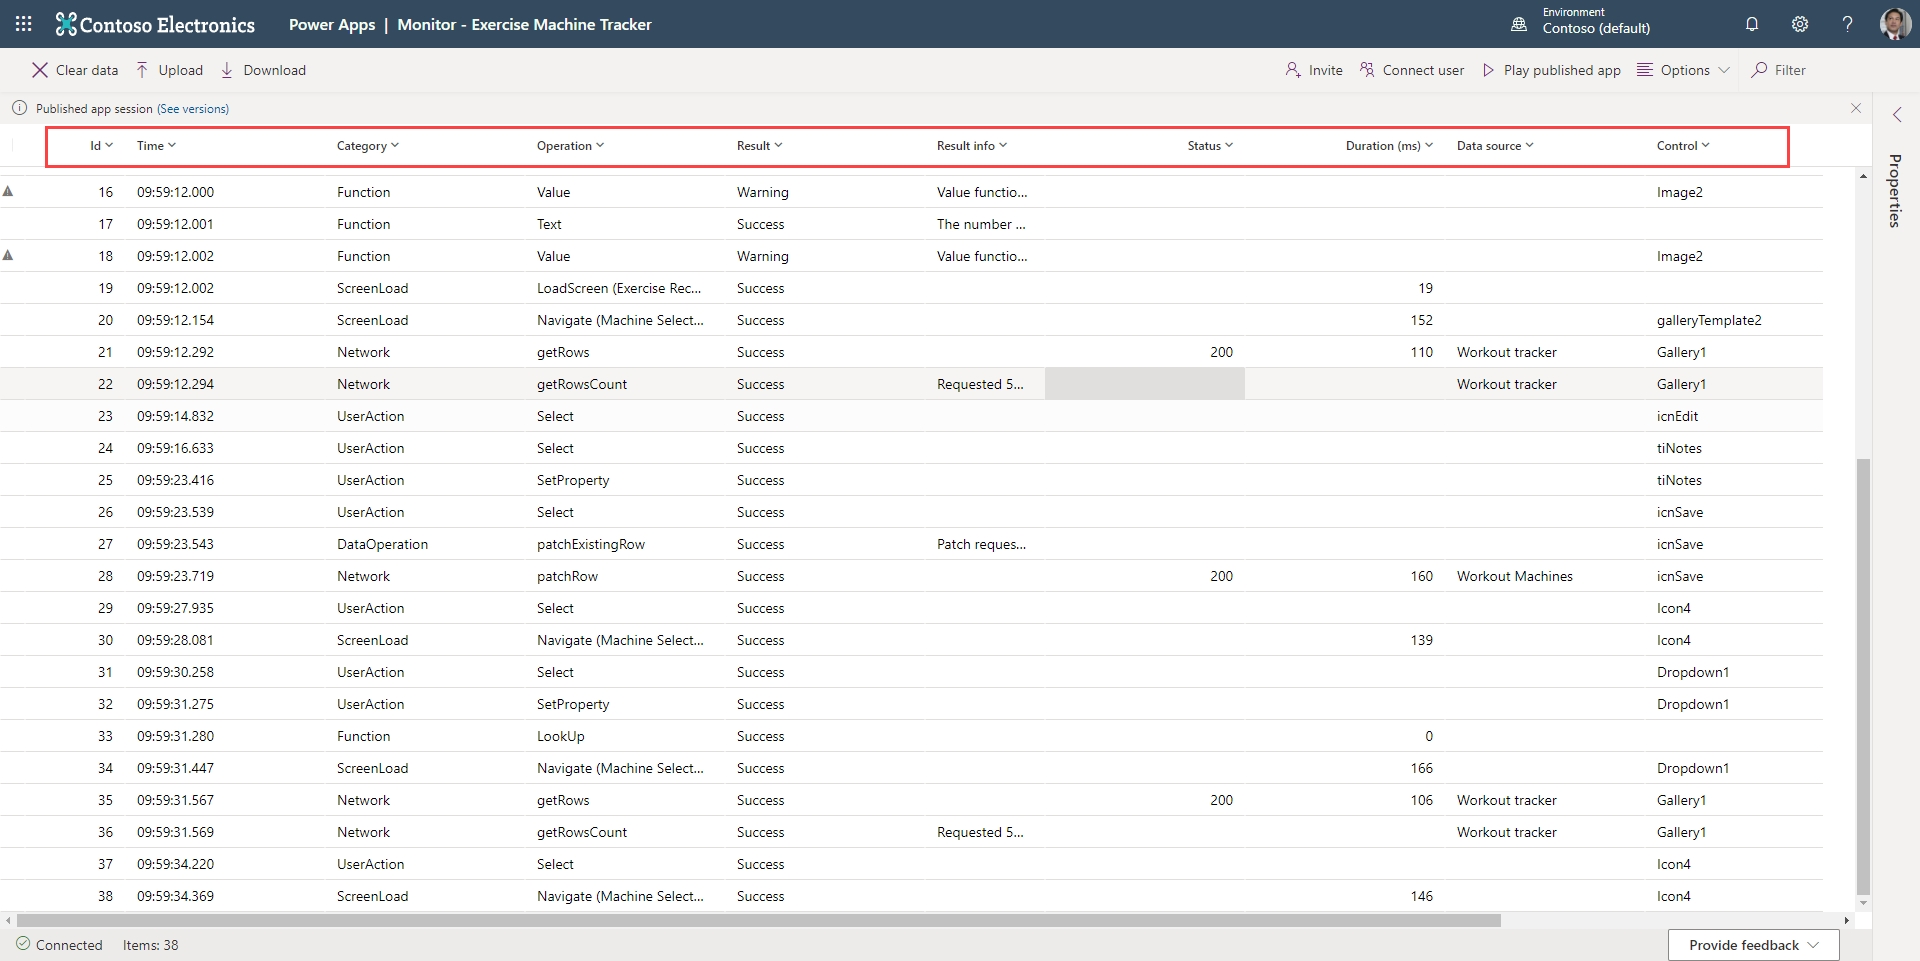
The Monitor dashboard lets you review properties for each app event. You'll get an idea of what happens when you select a control, the duration of the process, and the outcome of the operation.
Here's an image of what the Monitor dashboard looks like. Below the image is a summary of the information in each column of the dashboard.
Monitor properties panel
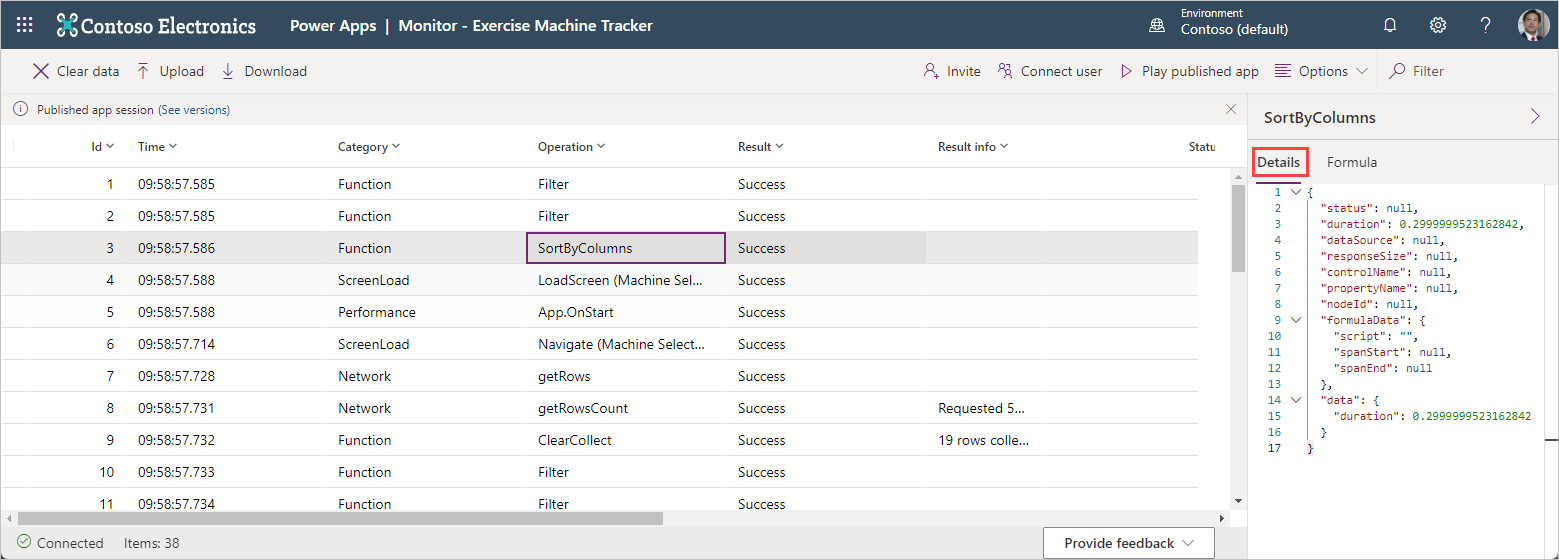
The Properties panel is available for a selected operation. To view the panel, select Properties from the side rail on the right. The Properties panel has tabs portraying details about the event. Every event will have a Details and Formula tab. If an event triggers an HTTP request/response, you'll also see tabs for Request and Response. This image depicts the Details tab for a SortByColumns event:
Starting Monitor
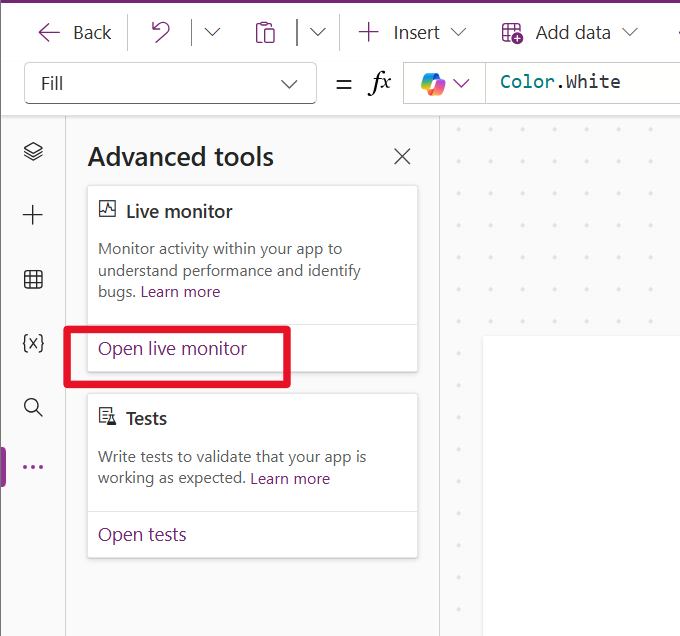
You can activate Monitor in two ways. When you're editing a canvas app, you can open Advanced tools from the left navigation bar, and then select Open live monitor.
Another way to open Monitor is by going to your list of apps in the Maker portal, selecting the three ellipses for any app, and then selecting Details and Live monitor from the header ribbon.
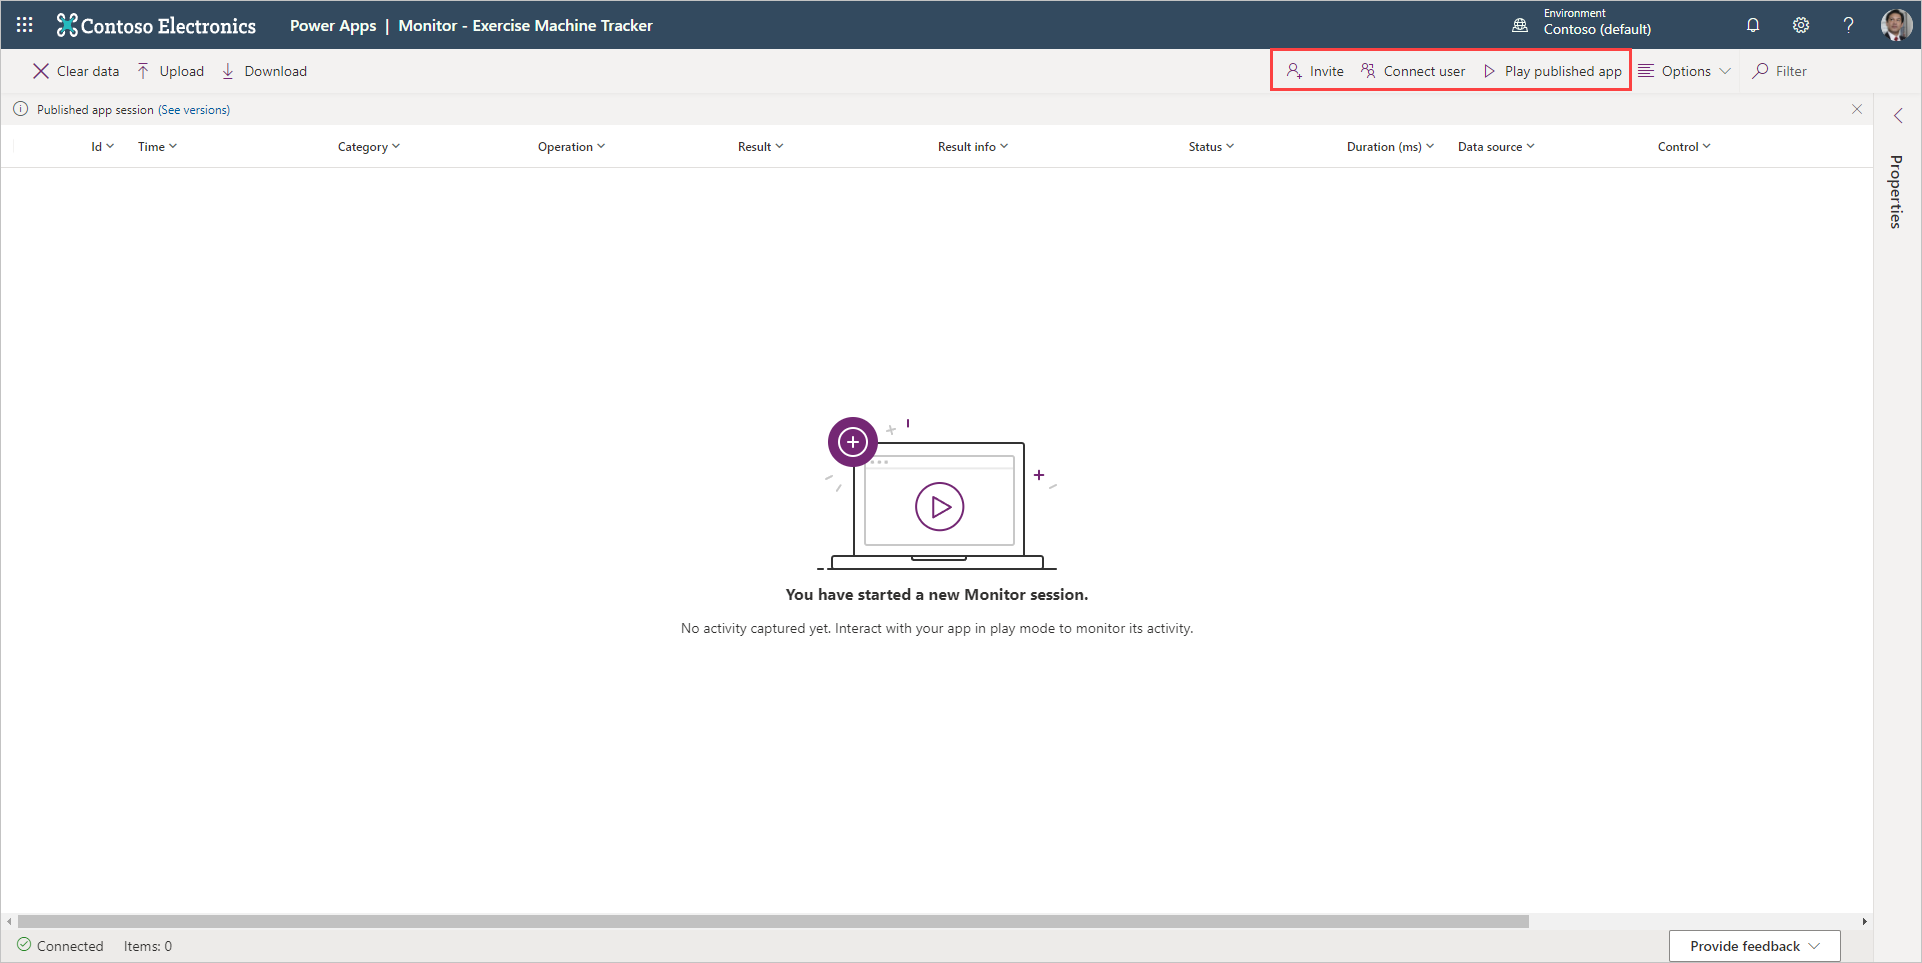
The Monitor dashboard opens in a new browser instance, allowing you to invite or connect with users so that you can monitor their interactions with the app. Or you can select Play published app to enter into your own session.
Whichever option you select causes Monitor to record any interactions with the app. If you opt to Play published app, a visual recording indicator appears beside your app to let you know that Monitor is active.
Learn more about using Monitor to debug Power Apps by consulting the available documentation and a blog post on the subject.
Introducing Power Apps analytics
To help analyze your app, Microsoft has provided Power Apps analytics, a series of reports providing a view into environment level usage, errors, service performance, and change management services. These reports are available for your canvas apps.
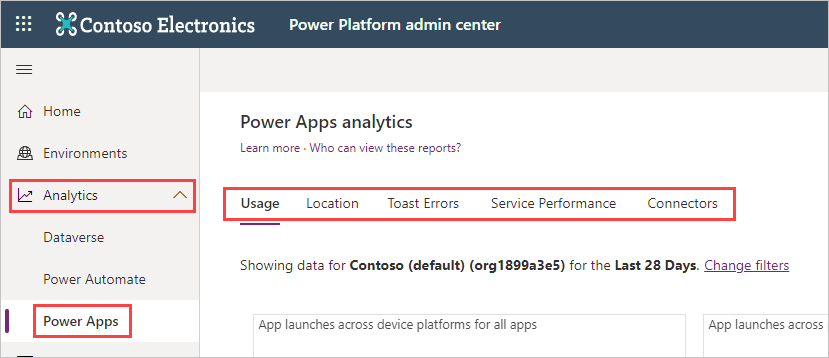
If you're an environmental admin or Power Platform admin, you'll have access to these reports. You can access them by signing into the Power Platform admin center and selecting Analytics > Power Apps. Reports appear in a menu bar at the top of the page. We'll cover the different reports available next. Admins can filter the view for all reports with attributes like device platform, player version, country or region, state, and city.
Available reports
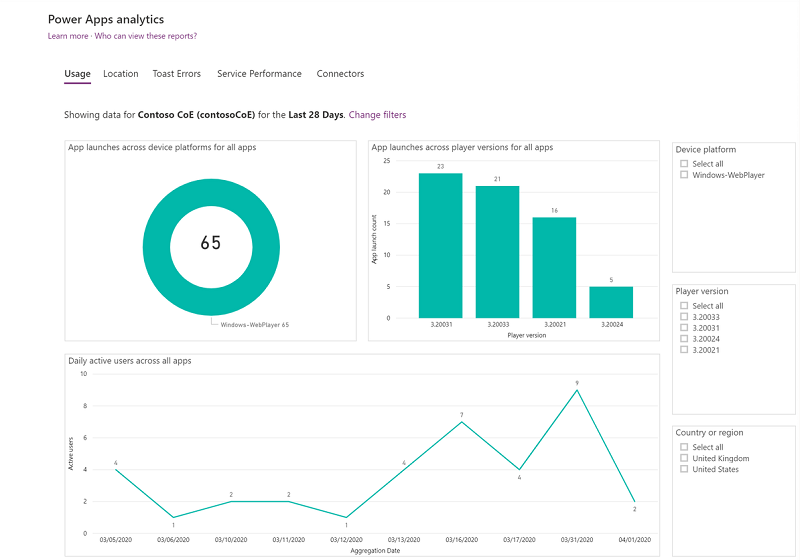
The Usage report is shown by default when logged in. It provides total app launches and daily active users across all apps in the environment.
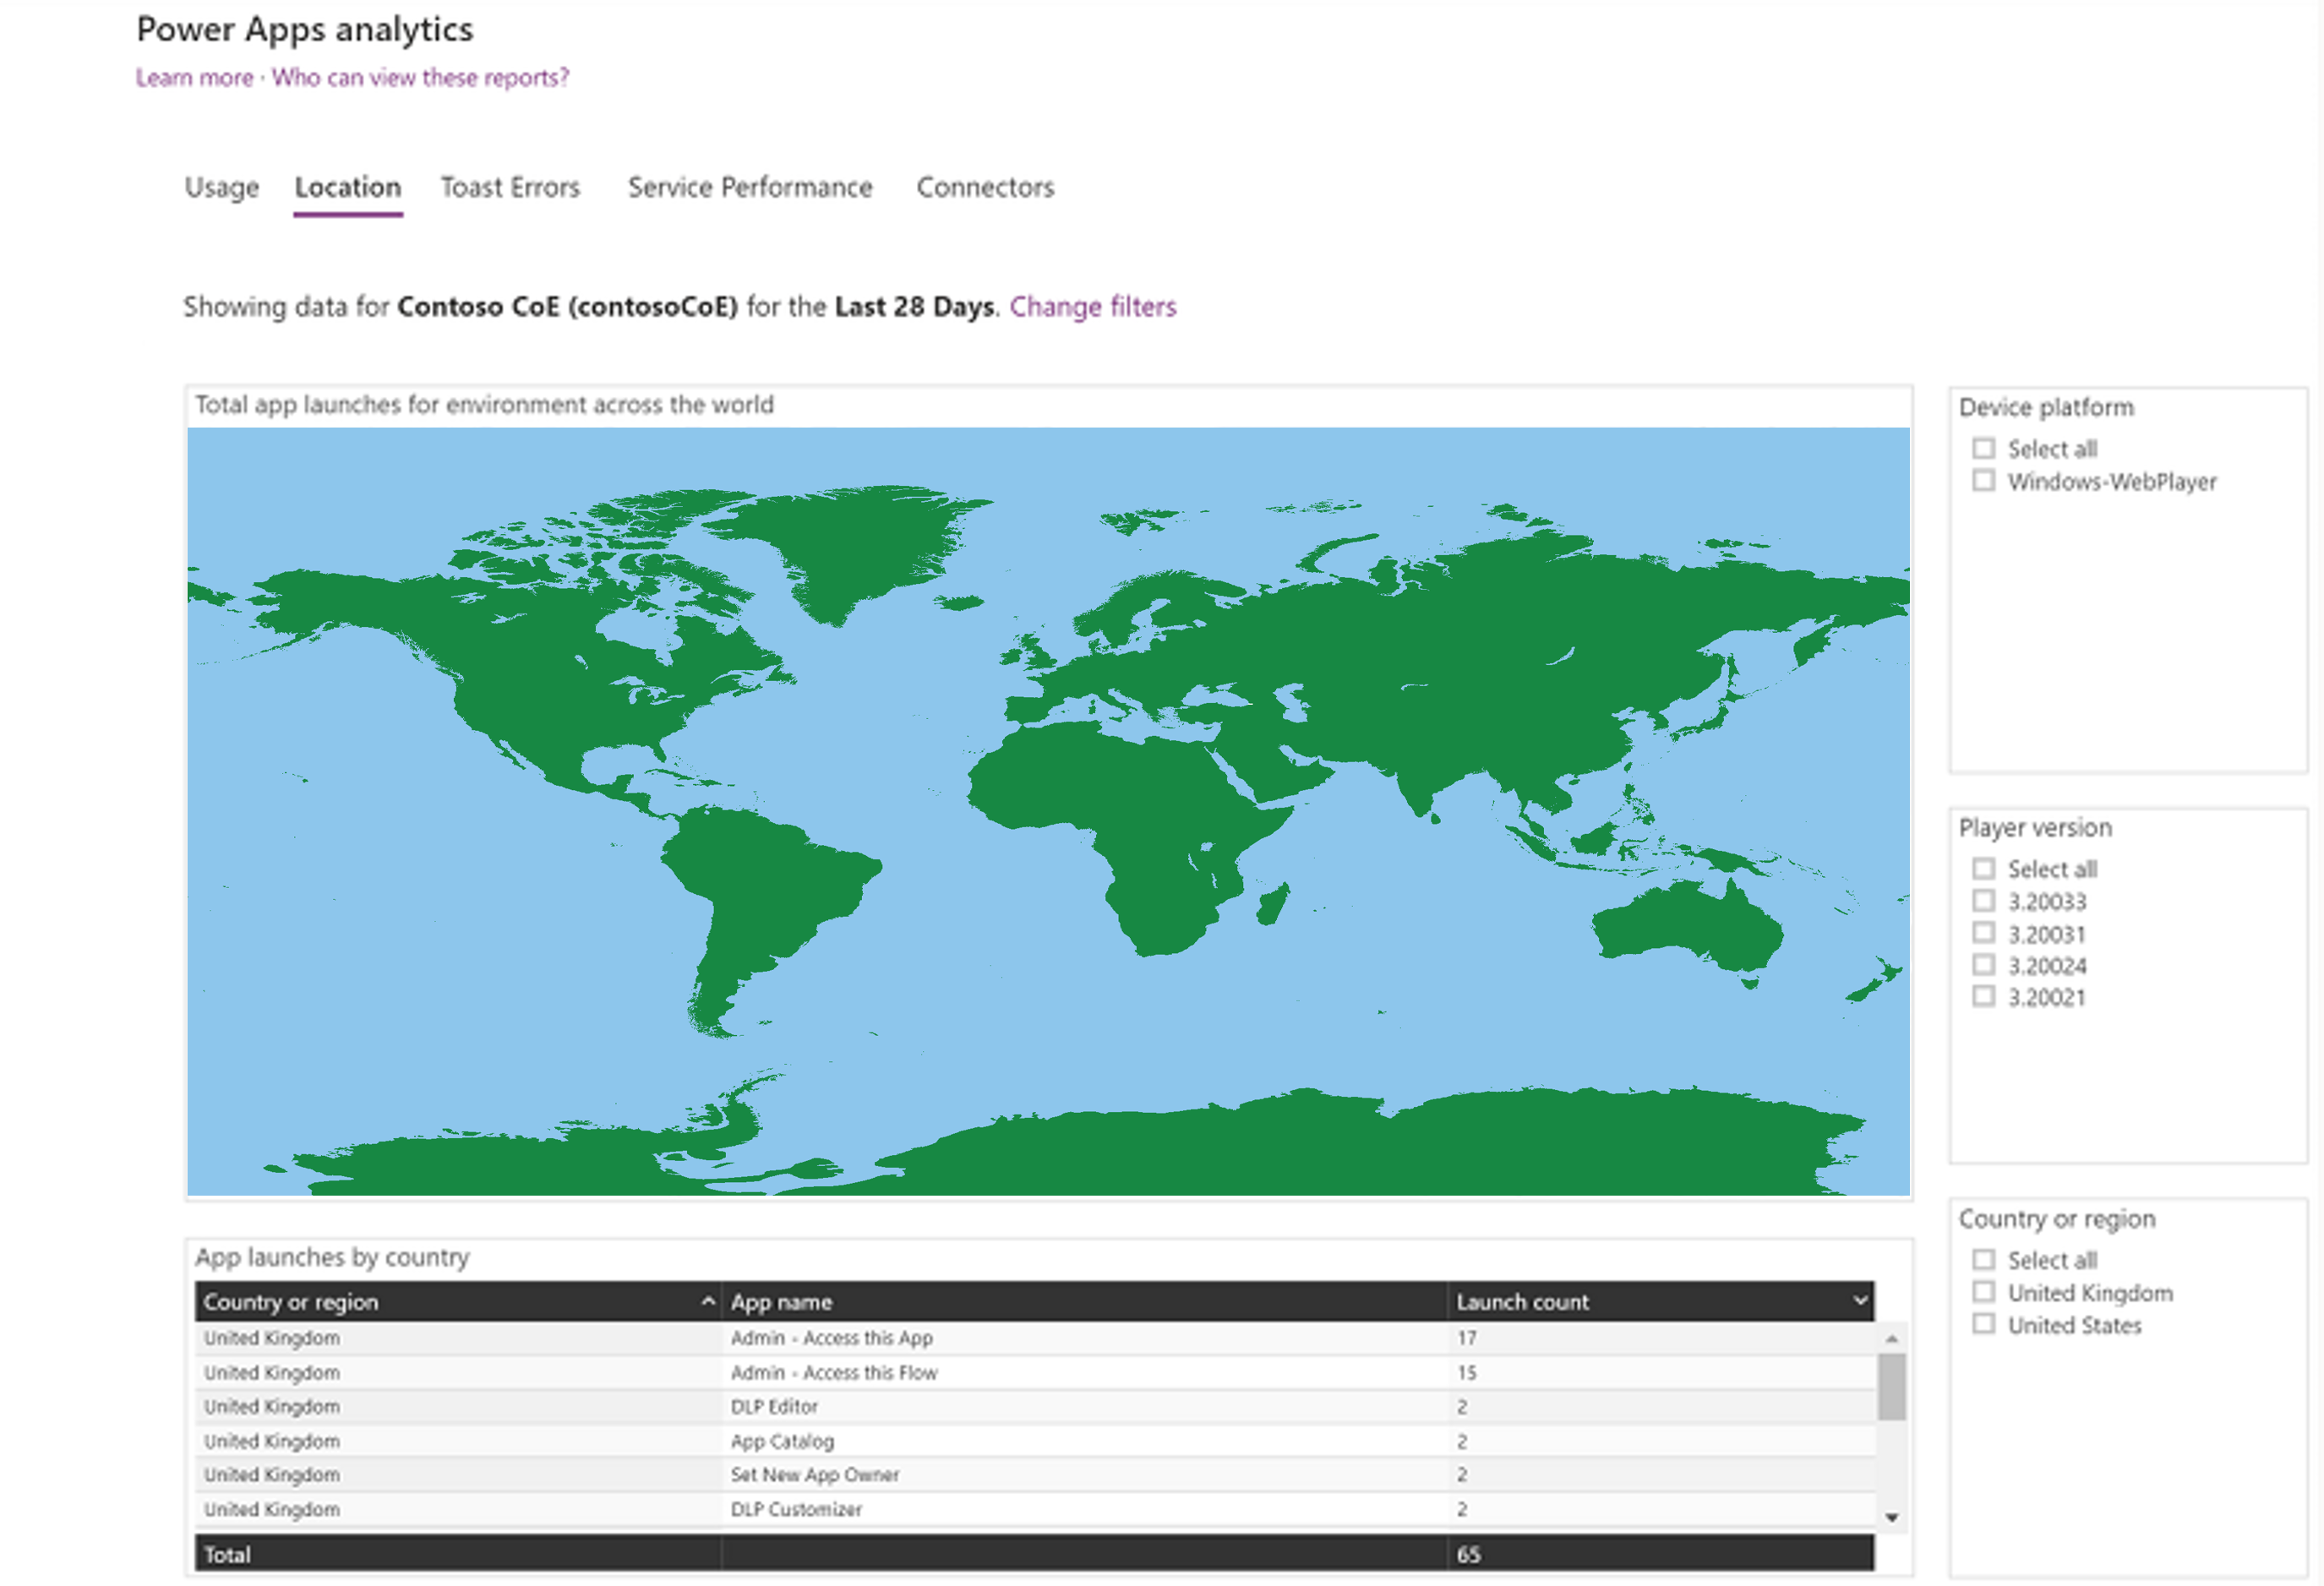
The Location report provides a map-based view of usage. It gives insight into regional adoption and usage trends.
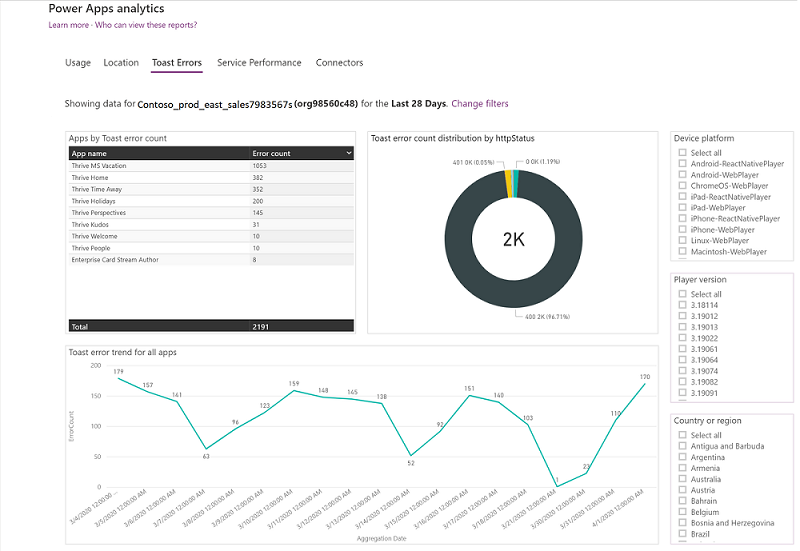
The Toast Errors report provides insights into the toast error trends, types, and counts per app to help drive improvements in app quality. Toast errors are errors displayed to the end users of the app.
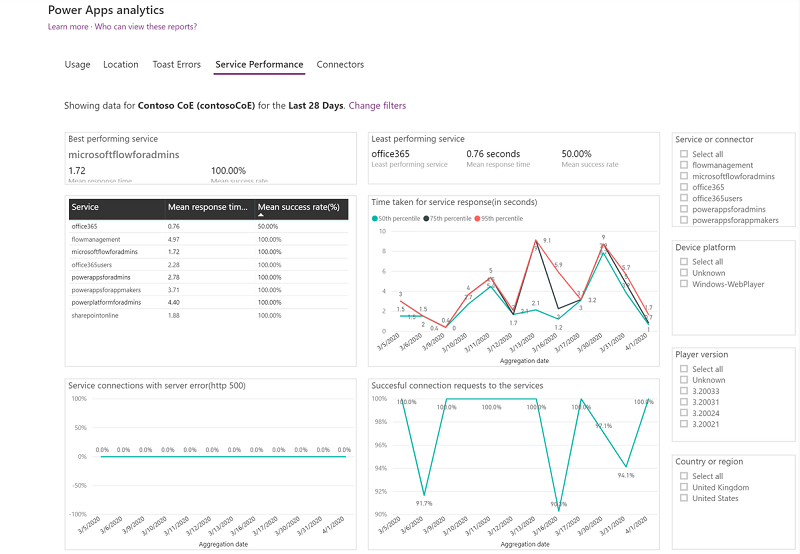
The Service Performance report provides details of all standard and custom connectors connected to your apps. These help to understand performance bottlenecks and client- versus service-side API issues. Here, you get insights into:
- Connectors used in the environment.
- Service performance and API service response times.
- Success rates for each service.
- The 50th, 75th, and 90th percentile response times for each service.
- The number of HTTP 500 error codes for connectors, which identify issues where the server did not respond to calls from the client.
- The number of successful connection requests.
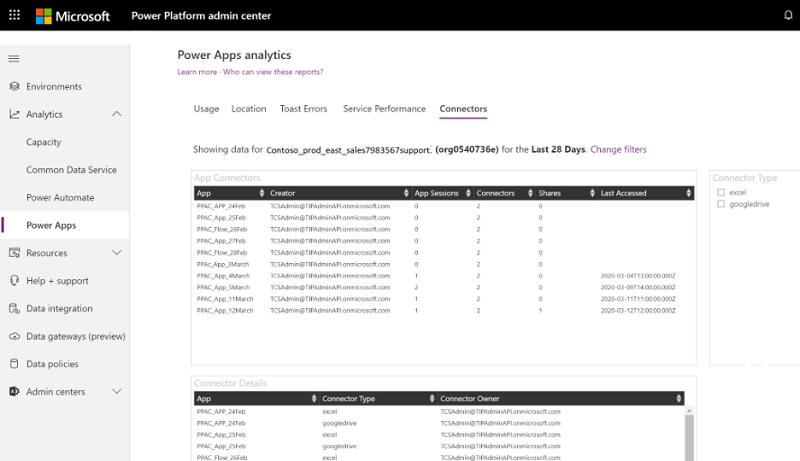
The Connectors report provides visibility into the standard and custom connectors being used by canvas apps. The last 28 days of data are visible at the environment level.
Admins can gain insights into the number of connectors associated with each app, the specific connectors being used by each app, and the owner of the connector. This report also provides the number of times the app has been shared, the number of app sessions, and the last accessed time for visibility into high usage apps and connectors.
It's possible to download reports and change environments within the app. Refer to Power Apps analytics to learn more.
