Walkthrough: Viewing Page Data in Excel Using PowerPivot (OData)
This walkthrough describes how you can use OData to expose a Microsoft Dynamics NAV 2018 page as a web service and then analyze the page data using Microsoft PowerPivot for Excel 2013. Similar steps also apply to PowerPivot for Excel 2010. For information about PowerPivot, see Microsoft PowerPivot.
About This Walkthrough
With OData and PowerPivot, you gain access to a powerful set of tools and technologies for data exchange and analysis. This walkthrough illustrates the following tasks:
Publishing a Dynamics NAV page as a web service.
Verifying web service availability from a browser.
Using the PowerPivot add-in for Excel to import the table data as a new worksheet.
This procedure also includes optional instructions about how to use a web service access key.
Creating a PivotTable from the worksheet, selecting relevant fields, and then organizing and formatting the data to highlight strategic data.
Prerequisites
To complete this walkthrough, you will need:
Microsoft Dynamics NAV 2018 with a developer license.
CRONUS International Ltd. demonstration database.
Excel 2013 with the PowerPivot add-in enabled. For more information, see Download PowerPivot page.
Optionally, if you want to use a web service access key to authenticate access to the web service, Dynamics NAV must meet the following requirements:
The Microsoft Dynamics NAV Server is configured to authenticate users by using the NavUserPassword credential type.
There is a Dynamics NAV user account that has a web service access key. In this walkthrough, the user account has the user name NavTest.
For more information, see Users and Credential Types.
Publishing a Page as a Web Service
You can publish a web service by using the Microsoft Dynamics NAV Web client or the Microsoft Dynamics NAV Windows client.
To register and publish a page as a web service
Open the RoleTailored client and connect to the CRONUS International Ltd. company.
In the Search box, enter Web Services, and then choose the related link.
In the Web Services page, choose New.
In the Object Type column, select Page. In the Object ID column, enter 21, and in the Service Name column, enter Customer.
This exposes the Customer Card page as an OData web service.
Select the check box in the Published column.
Choose the OK button to close the New - Web Services page.
Verifying the Web Service’s Availability
Important
After publishing a web service, verify that the port that web service applications will use to connect to your web service is open. The default port for OData web services is 7048. You can configure this value by using the Microsoft Dynamics NAV Server Administration Tool.
To verify availability of a Dynamics NAV web service
Start Windows Internet Explorer.
In the Address field, enter a URI using the following format: https://<Server>:<WebServicePort>/<ServerInstance>/OData/
Server is the name of the computer that is running Microsoft Dynamics NAV Server.
WebServicePort is the port that OData is running on. The default port is 7048.
ServiceInstance is the name of the Microsoft Dynamics NAV Server instance for your solution. The default name is DynamicsNAV110.
For example, if the Microsoft Dynamics NAV Server is running on the computer that you are working on, you can use: https://localhost:7048/DynamicsNAV110/OData/
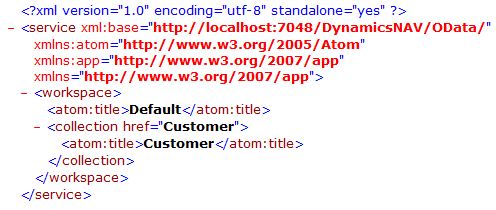
The browser should now show the web service that you have published, as shown in the following illustration.

Note
If the browser cannot find the web service, it may indicate that the specified Microsoft Dynamics NAV Server instance is not running. For more information, see Managing Microsoft Dynamics NAV Server Instances.
Importing Dynamics NAV Data into Excel
In the following procedures, you use PowerPivot to import Dynamics NAV data into Excel. If you will be using a web service access key for authentication, only perform the second procedure; otherwise, only perform the first procedure.
To import Dynamics NAV data into Excel
Start Microsoft Excel.
In Excel, on the PowerPivot tab, choose Manage. This opens the PowerPivot for Excel window.
In PowerPivot, on the Home tab, choose Get External Data, choose From Data Service, and then choose From OData Data Feed.
The Table Import Wizard opens.
If your Dynamics NAV implementation requires that you use a web service access key, you must specify the NavUserPassword credentials as described in the following steps:
In the Advanced dialog box, in the Security section, set the Integrated Security field to Basic.
If your OData is configured to use SSL, then set the field to SSPL.
In the Password field, type the web service access key.
In the UserID field, type the user name for the Dynamics NAV user account. For this walkthrough, use NavTest.
In the Source section, in the Service Document URL field, type the URL for the OData web service that you verified in the previous procedure, for example, https://localhost:7048/DynamicsNAV110/OData/.
Choose the OK button to return to the Table Import Wizard.
In the Connect to a Data Feed page, in the Data Feed Url field, enter the OData URI that you verified in the previous procedure, for example https://localhost:7048/DynamicsNAV110/OData/. Choose the Next button.
Important
The URI must end with a slash (/) as shown in the example.
Verify that Customer appears in the Source Table column.
Select the check box next to the Customer web service, and then choose Finish.
After you see the Success message, choose the Close button.
The data from the Customer OData web service displays, and you can use the data to build pivot-based views in the Excel workbook.
Creating a PivotTable Containing Key Dynamics NAV Data
In this procedure, you use the Excel workbook with data from the Customer web service to create a PivotTable from the worksheet. You select relevant fields and then organize and format the data to highlight strategic data. Building a pivot table is a way to select and arrange data so as to highlight and focus on key elements.
To create a PivotTable
In Excel, select the cell where you want the PivotTable located.
In the ribbon, choose the Insert tab, and then in the Tables group, choose PivotTable.
In the Create PivotTable dialog box, select Use an external data source, and then choose the Choose Connection button.
In the Existing Connections dialog box, on the Connections tab, under Connections in this Workbook, choose the data feed for your OData web service, and then choose the Open button.
Choose the OK button to add the PivotTable to the Excel worksheet.
The PowerPivot Field pane on the right side includes a list of fields from the Customer web service that where imported from PowerPivot.
In the PowerPivot Field List pane, choose Location_Code.
Tip
To quickly find a field in the field list, type part or all of the field name in the Search text box that is above the list of fields, and then press Enter to highlight the first field that contains the text. You can then choose the right arrow to proceed to the next field, and so on.
Select the Balance_LCY field.
Select the Name field.
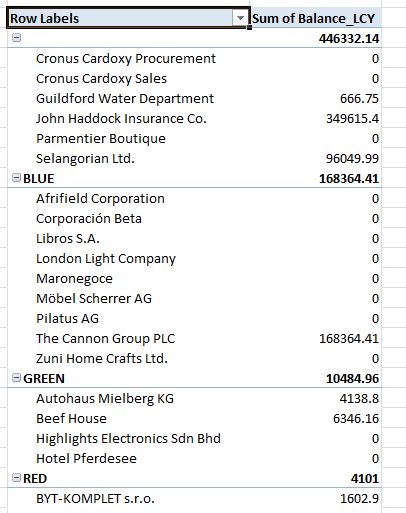
You can now see the data in the body of the worksheet, as shown in the following illustration.

The PivotTable shows customers by location and individual customer balances, and also adds the balances by location. To make the information more readable, you can update the headings on the PivotTable.
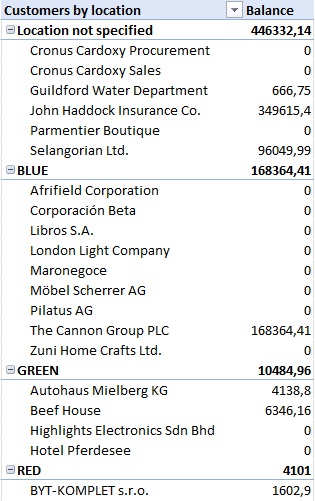
Select the cell that has the heading Sum of Balance_LCY, and then, in the formula field, type Balance.
Select the cell that has the heading Row Labels, and then in the formula field, type Customers by location.
Select the empty cell that is below the Customers by location cell, and then, in the formula field, type Location not specified.
The following illustration shows how the worksheet looks after you make these changes.

Next Steps
Now that you have created your PivotTable, you can continue to enhance the data to make it more useful and readable. You can:
Add a column to the data that shows average balance by region.
Enhance data presentation with a graph.
Post the data in a Microsoft SharePoint environment with live data from Microsoft Dynamics NAV 2018.
For more information about how to use Dynamics NAV data with PowerPivot information, see Walkthrough: Combining Data from Microsoft Dynamics NAV Queries and Pages with Data from Azure DataMarket (OData).