Use gates and approvals to control your deployment
TFS 2018
By using a combination of manual deployment approvals, gates, and manual intervention in your release pipeline, you can quickly and easily configure your deployment to meet all the specific pre-deployment requirements for your workflow.
In this tutorial, you will learn about:
- Pre-deployment gates
- Manual intervention
- Manual validation
- Deployment logs
Prerequisites
Complete the Define your multi-stage release pipeline tutorial.
A work item query. Create a work item query in Azure Boards if you don't have one already.
Set up gates
You can use gates to ensure that the release pipeline meets specific criteria before deployment without requiring user intervention.
Select Pipelines > Releases, and then select your release pipeline. Select Edit to open the pipeline editor.

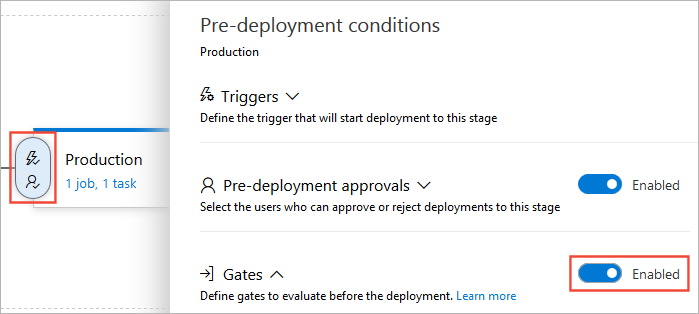
Select the pre-deployment icon for your stage, and then select the toggle button to enable Gates.
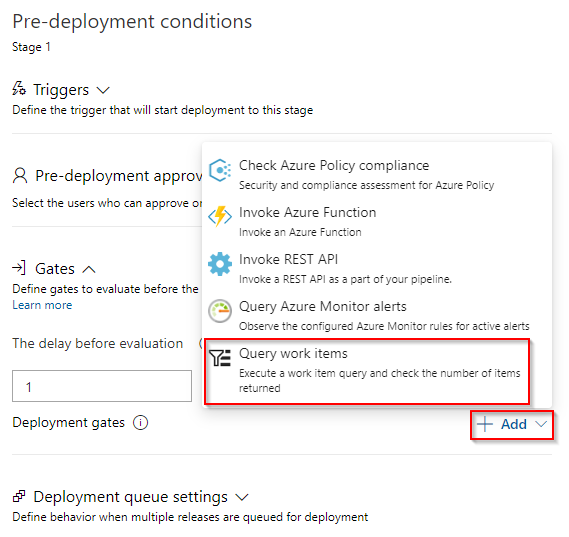
Specify the delay time before the added gates are evaluated. This time is to allow gate functions to initialize and stabilize before returning results.

Select Add, and then select Query Work Items.
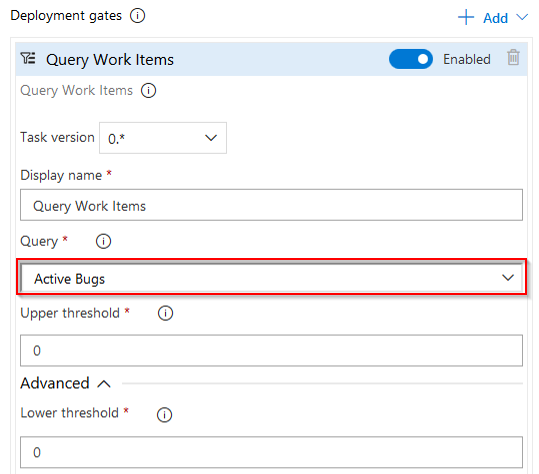
Select an existing work item query from the dropdown menu. Depending on how many work items you expect the query to return, set your maximum and minimum thresholds.
Select the Evaluation options section, and then specify the timeout and sampling interval. The minimum values you can specify are 6-minutes timeout and 5-minutes sampling interval.
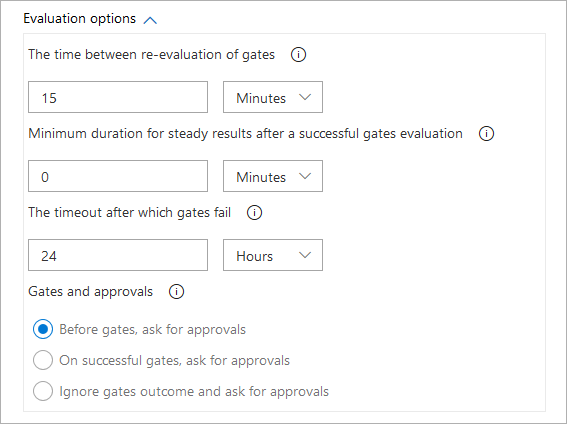
Select Save when you're done.

Set up manual intervention
Depending on the scenario, sometimes you may need to add manual intervention to your release pipeline. You can do this by adding the Manual Intervention task to your pipeline.
Select Pipelines > Releases. Select your release pipeline, and then select Tasks and choose your stage.

Select the ellipses (...), and then select Add an agentless job.
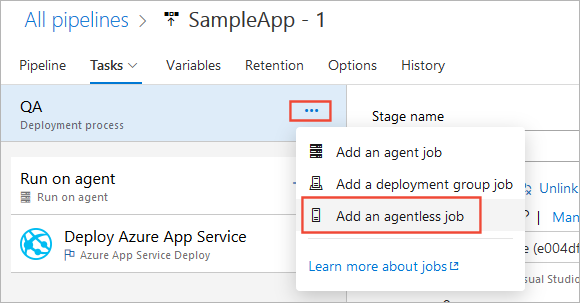
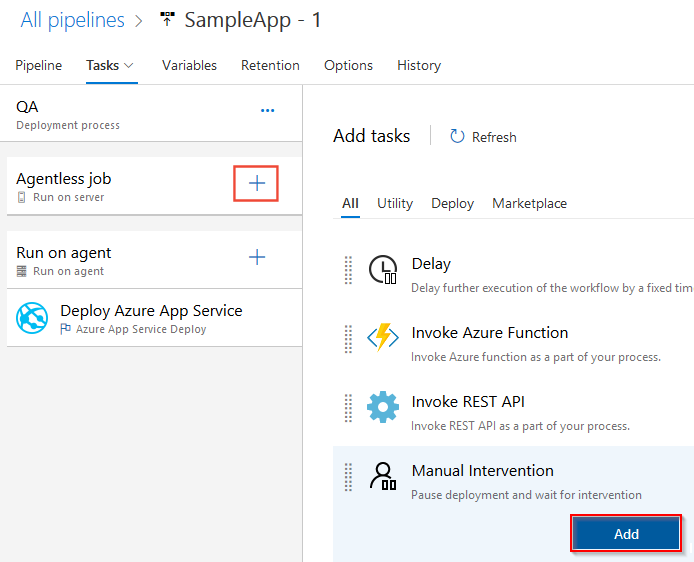
Drag and drop the agentless job to the top of your deployment process. Select the (+) sign, and then select Add the Manual Intervention task.
Enter a Display name and the instructions that will be displayed when the task is triggered. You can also specify a list of users to be notified and a timeout action (reject or resume) if no intervention occurred within the timeout period.
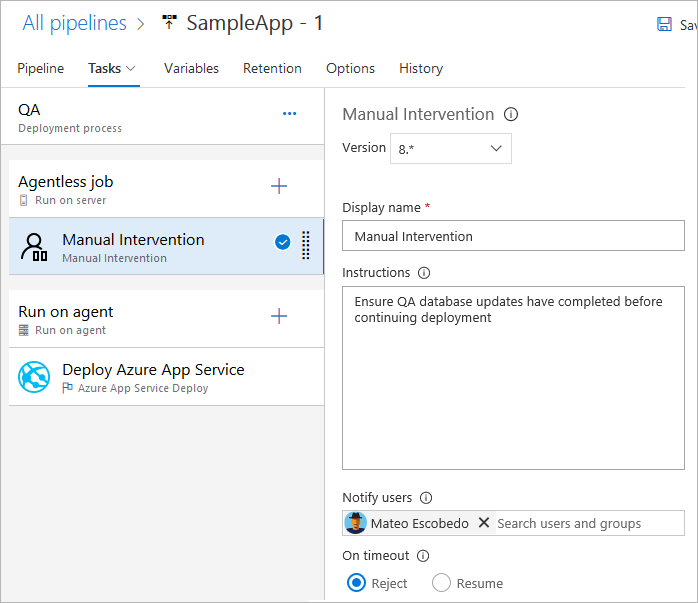
Select Save when you're done.
Note
The Manual Intervention task can only be used in an agentless job.
Set up manual validation
You can use the Manual Validation task in your YAML pipeline to pause and wait for manual approval. Manual validation is especially useful in scenarios where you want to validate configuration settings or build packages before starting a computation-intensive job.
The waitForValidation job pauses the run and triggers a UI prompt to review and validate the task. The email addresses listed in notifyUsers receive a notification to approve or deny the pipeline run.

pool:
   vmImage: ubuntu-latest

jobs:
- job: waitForValidation
  displayName: Wait for external validation
  pool: server
  timeoutInMinutes: 4320 # job times out in 3 days
  steps:
   - task: ManualValidation@0
     timeoutInMinutes: 1440 # task times out in 1 day
     inputs:
         notifyUsers: |
            someone@example.com
         instructions: 'Please validate the build configuration and resume'
         onTimeout: 'resume'
View deployment logs
Deployment logs are useful to debug deployment issues but you can also use them to audit your pipeline runs and verify approvals and how they were granted and by whom.
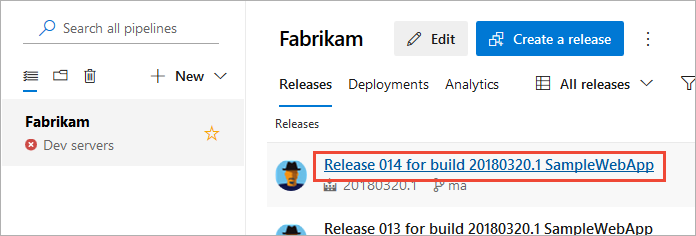
Select Pipelines > Releases, and then select your release pipeline.
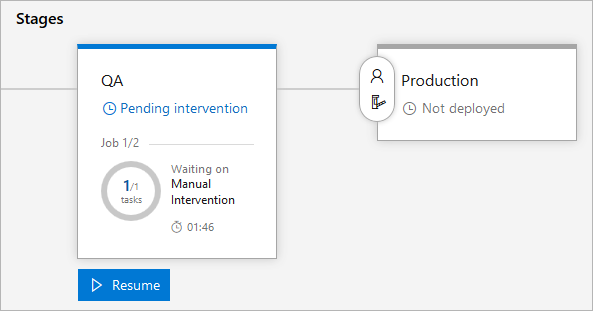
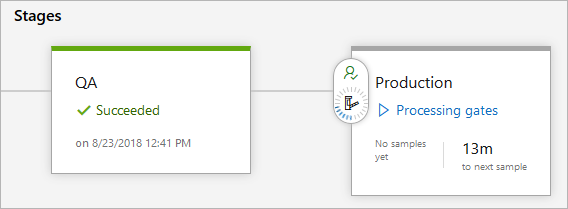
This view will show you a live status of each stage in your pipeline. The QA stage in this example is pending intervention. Select Resume.
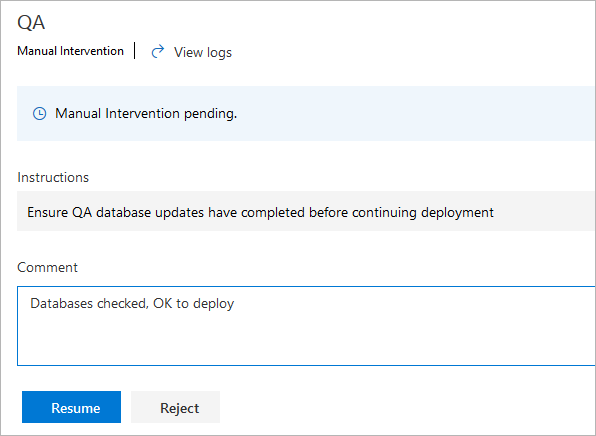
Enter your comment, and then select Resume.
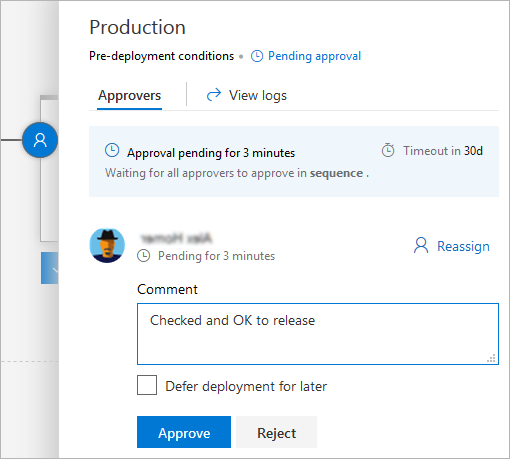
The QA stage deployment succeeded and the pre-deployment approvals are triggered for the Production stage.
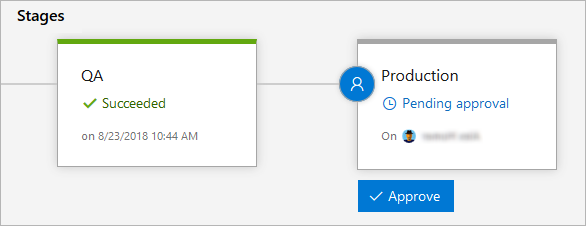
Select Approve, enter your comment and then select Approve to continue deployment.
The live status indicates that the gates are being processed for the Production stage before the release continues.
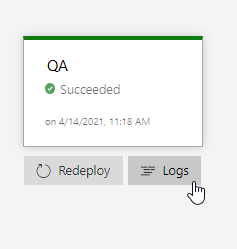
Return to your release pipeline, hover over your stage and then select Logs to view the deployment logs.
