OMS Log Analytics: Collect, Visualize and Analyze Log File Data
This blog post uses a simple test scenario to show how we can collect, visualize and analyze data collected from a log file, with OMS Log Analytics. This test scenario can be used in a POC (Proof-Of-Concept) to demonstrate how the following features in OMS Log Analytics - Custom Logs, Custom Fields, and Direct Agent, can be configured to work in coherence to provide a custom monitoring solution.
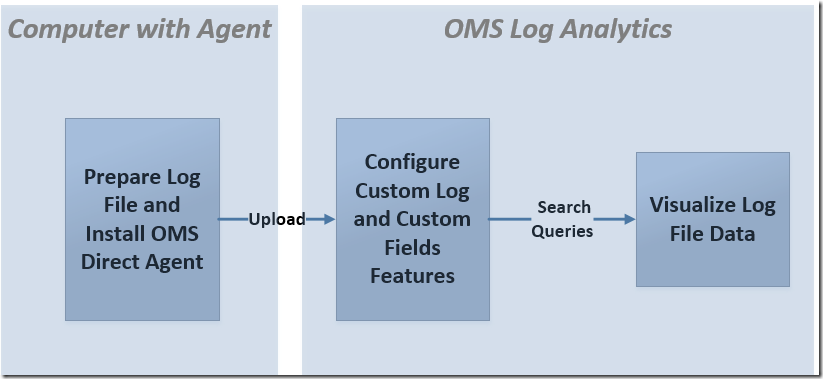
Here is a high level view of what needs to be configured:
Preparing the Log File:
For our test scenario, lets say we have a customer facing application that logs information about each critical transaction at a frequent basis into a text file in the following format:
2016-06-21 05:19:01|Transaction:TRANX001|Type:TransactionTypeA|Description:TRANX001 is .... |Metric:Avg. Resp. Time [ms]|ResponseTime:6.14"
2016-06-21 05:18:01|Transaction:TRANX002|Type:TransactionTypeA|Description:TRANX002 is .... |Metric:Avg. Resp. Time [ms]|ResponseTime:33.64"
2016-06-21 05:17:01|Transaction:TRANX003B|Type:TransactionTypeB|Description:TRANX003B is .... |Metric:Avg. Resp. Time [ms]|ResponseTime:23.27"
2016-06-21 05:16:01|Transaction:TRANX017R|Type:TransactionTypeC|Description:TRANX017R is .... |Metric:Avg. Resp. Time [ms]|ResponseTime:36.27"
2016-06-21 05:15:01|Transaction:TRANX007|Type:TransactionTypeC|Description:TRANX007 is .... |Metric:Avg. Resp. Time [ms]|ResponseTime:3.93"
2016-06-21 05:14:01|Transaction:TRANX063|Type:TransactionTypeA|Description:TRANX063 is .... |Metric:Avg. Resp. Time [ms]|ResponseTime:5.51"
2016-06-21 05:13:01|Transaction:TRANX015b|Type:TransactionTypeB|Description:TRANX015b is .... |Metric:Avg. Resp. Time [ms]|ResponseTime:34.68"
This format satisfies the criteria for the text file to become a Custom Log data source in Log Analytics. For more information on Custom Logs and the data format criteria, refer to Brian Wren’s guide on Custom Logs in Log Analytics.
The text file can be stored in a folder of a Windows or Linux computer, eg. C:\TempPath

Install OMS Direct Agent:
The Microsoft Monitoring Agent for OMS Log Analytics can be installed on the Windows computer where the text file is stored, and configured to report and send data directly to a specific OMS Workspace.

Configuring the Custom Logs Feature:
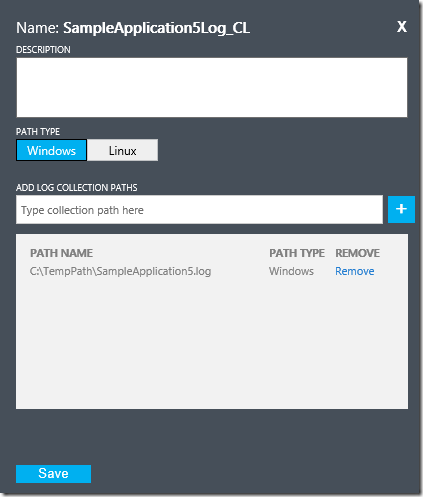
On the Overview > Settings Dashboard page, select the Data tab, then select the Custom Logs option and click the Add + button to open the Custom Log configuration page. Upload a sample version of the text file, select a record delimiter (New line or Timestamp), enter the path of the text file, eg. C:\TempPath\SampleApplication5.log, and provide a name as the “Type” to categorize the data collected from the text file. eg SampleApplication5_CL. Additional information can be added into the Description field.
Refer to Custom Logs in Log Analytics for more information on how to configure the Custom Logs feature.
Configuring the Custom Fields Feature:
First, validate that the data in the text file is being collected successfully and searchable in OMS Log Analytics by running a search query of Type=<FileDataTypeName>_CL, eg. Type=SampleApplication5_CL

Then, create searchable fields by highlighting and extracting the words or strings of interest in the raw data field of an existing record by using the Custom Fields feature.
For searchable fields with numerical values, use the Numerical Field Type while for fields with strings or names, use the Text Field Type instead.
For more information on how to configure Custom Fields, visit Brian’s guide.

Important Note:
Custom fields will only show up on data that comes into OMS after you configure them to be extracted. It does not retroactively extract custom fields, it only performs extractions during ingestion time.
Hence only the data collected after the custom fields have been configured for the specific type will have their new searchable fields populated with the required values from the rawdata field.

Refer to Evan’s blog post on the OMS Custom Fields Feature at the System Center: Operations Manager Engineering Blog for more information on Custom Fields.
Visualizing Collected Log File Data with Search Queries:
With the Custom Logs and Custom Fields features configured, and data being collected successfully from the text file every time new data is written to it, the records can be visualized and analyzed using search queries in the OMS Log Analytics workspace portal.
Here are some examples:
a. A query to display the maximum response time recorded (in ms) for each transaction over time on a performance view on an hourly interval:
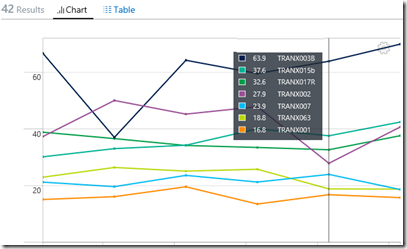
Type=SampleApplication5_CL | measure max(ResponseTimeMetric5Numeric_CF) by AppName5_CF interval 1HOUR
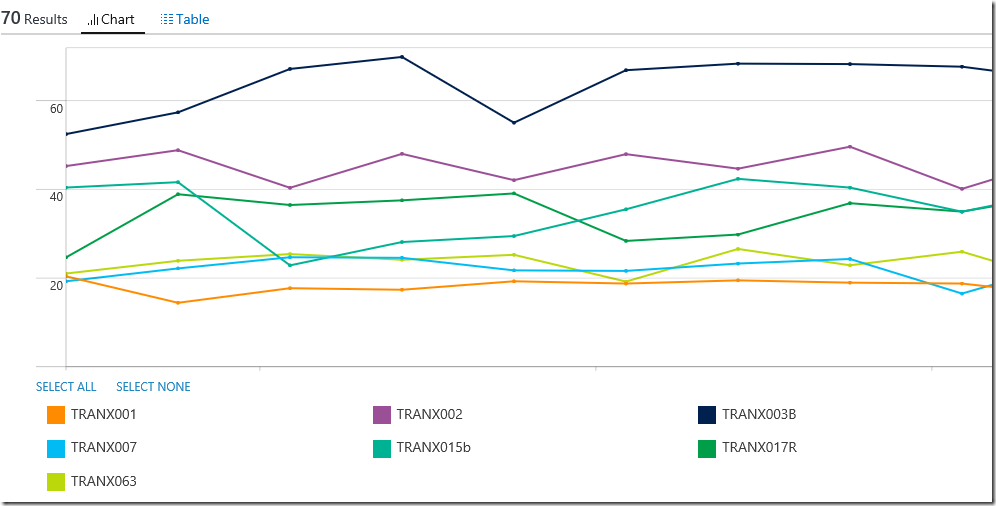
b. A query to compare the average response time recorded (in ms) for each transaction in sortable order within a specific time period:
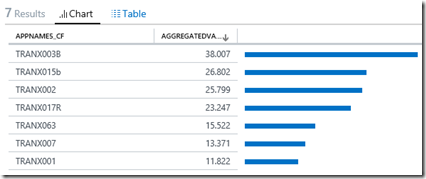
Type=SampleApplication5_CL | measure avg(ResponseTimeMetric5Numeric_CF) by AppName5_CF

c. A query to compare the number of transactions that exceeds 30 ms in response time, grouped by transaction name and in sortable order within a specific time period:
Type=SampleApplication5_CL ResponseTimeMetric5Numeric_CF > 30 | measure count() by AppName5_CF

Running A Simulation:
To simulate a scenario where the text file is updated with application transaction information on a frequent basis, here is a PowerShell script that generates random numerical values within a given minimum and maximum range for each transaction’s response time. Every time the script is run, it writes the information into the SampleApplication5.log file located in the server installed with the Microsoft Monitoring Agent for OMS.
The PowerShell script can then be triggered on an interval of 10 – 15 minutes with the task scheduler to update the contents of the text file and allow new data to be collected into OMS Log Analytics via the Direct Agent.
############################################ Script Start ###############################################
$newline = "`r`n"
$TRANX001AvgResponseTime = [math]::round((Get-Random -min 3.11 -max 30.55),2)
$TRANX002AvgResponseTime = [math]::round((Get-Random -min 6.11 -max 50.55),2)
$TRANX003BAvgResponseTime = [math]::round((Get-Random -min 1.11 -max 60.55),2)
$TRANX017RAvgResponseTime = [math]::round((Get-Random -min 4.11 -max 40.55),2)
$TRANX007AvgResponseTime = [math]::round((Get-Random -min 2.11 -max 25.55),2)
$TRANX063AvgResponseTime = [math]::round((Get-Random -min 5.11 -max 26.55),2)
$TRANX15bAvgResponseTime = [math]::round((Get-Random -min 7.11 -max 42.55),2)
$theDay = get-date -format yyyy-MM-dd
$theTime1 = (Get-Date).AddSeconds(-10).ToString('hh:mm:ss')
$string1 = $theDay + " " + $theTime1 + "|Transaction:TRANX001|Type:TransactionTypeA|Description:TRANX001 is .... |Metric:Avg. Resp. Time [ms]|ResponseTime:" + $TRANX001AvgResponseTime + "`"" + $newline
$theTime2 = (Get-Date).AddSeconds(-20).ToString('hh:mm:ss')
$string2 = $theDay + " " + $theTime2 + "|Transaction:TRANX002|Type:TransactionTypeA|Description:TRANX002 is .... |Metric:Avg. Resp. Time [ms]|ResponseTime:" + $TRANX002AvgResponseTime + "`"" + $newline
$theTime3 = (Get-Date).AddSeconds(-30).ToString('hh:mm:ss')
$string3 = $theDay + " " + $theTime3 + "|Transaction:TRANX003B|Type:TransactionTypeB|Description:TRANX003B is .... |Metric:Avg. Resp. Time [ms]|ResponseTime:" + $TRANX003BAvgResponseTime + "`"" + $newline
$theTime4 = (Get-Date).AddSeconds(-40).ToString('hh:mm:ss')
$string4 = $theDay + " " + $theTime4 + "|Transaction:TRANX017R|Type:TransactionTypeC|Description:TRANX017R is .... |Metric:Avg. Resp. Time [ms]|ResponseTime:" + $TRANX017RAvgResponseTime + "`"" + $newline
$theTime5 = (Get-Date).AddSeconds(-50).ToString('hh:mm:ss')
$string5 = $theDay + " " + $theTime5 + "|Transaction:TRANX007|Type:TransactionTypeC|Description:TRANX007 is .... |Metric:Avg. Resp. Time [ms]|ResponseTime:" + $TRANX007AvgResponseTime + "`"" + $newline
$theTime6 = (Get-Date).AddSeconds(-60).ToString('hh:mm:ss')
$string6=$theDay + " " + $theTime6 + "|Transaction:TRANX063|Type:TransactionTypeA|Description:TRANX063 is .... |Metric:Avg. Resp. Time [ms]|ResponseTime:" + $TRANX063AvgResponseTime + "`"" + $newline
$theTime7 = (Get-Date).AddSeconds(-70).ToString('hh:mm:ss')
$string7=$theDay + " " + $theTime7 + "|Transaction:TRANX15b|Type:TransactionTypeB|Description:TRANX15b is .... |Metric:Avg. Resp. Time [ms]|ResponseTime:" + $TRANX15bAvgResponseTime + "`""
$string1+$string2+$string3+$string4+$string5+$string6+$string7 | Out-File -Encoding ASCII C:\TempPath\SampleApplication5.log
#Writes formatted strings to destination “C:\TempPath\SampleApplication5.log”
########################################## Script End #################################################
Configuring the task scheduler:
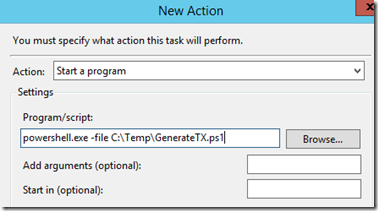
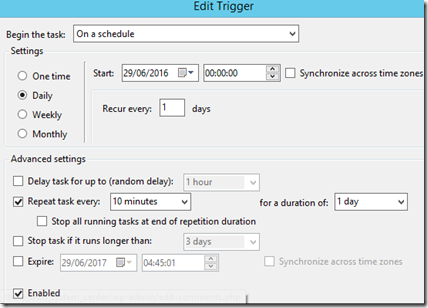
With the data successfully collected from the text file and custom fields defined, custom Tiles, Dashboards with drill-ins can be configured using the new OMS View Designer:
https://blogs.msdn.microsoft.com/wei_out_there_with_system_center/2016/07/03/oms-log-analytics-create-tiles-drill-ins-and-dashboards-with-the-view-designer/
Additional Resources on Custom Logs and Custom Fields:
Monitor VMware using OMS Log Analytics by Keiko Harada:
https://blogs.technet.microsoft.com/msoms/2016/06/15/monitor-vmware-using-oms-log-analytics/
Thank you for your support !
