Tuning a Parallel LINQ File Search Application
This post explores the performance issues that arise when using PLINQ to parallelize queries, and illustrates how the Concurrency Visualizer in Visual Studio 2010 can be a valuable tool in identifying performance bottlenecks and making efficient and profitable parallelization choices. The subject of this entry is a toy application that scans a set of files for a user-specified pattern and performs some processing every time it finds an occurrence of the pattern. The processing in this case is a simple count of the number of matches. In spite of its small size, the application provides insight into several issues that arise in parallelization using PLINQ.
Figure 1: Sequential version of the scan algorithm. The LINQ query is highlighted.
The starting point is a sequential version of the search algorithm expressed using LINQ shown in figure 1. Arguments to the function specify the pattern to be searched, as well as the files that are to be searched from a starting path and a pattern of searchable files. The code queries all lines in all applicable files for the pattern specified. A Stopwatch is used to measure the time consumed in this region. Also note the use of a “scenario marker" to identify and demarcate the interesting search region in the Concurrency Visualizer. The use of scenario marker is explained in detail in a previous blog entry.
This application is profiled in Visual Studio 2010 Concurrency Visualizer. Since the topic of this entry is to understand the parallelization of CPU-intensive LINQ fragments, the application makes three successive calls to Scan function with the same arguments so that virtual memory and page files are warmed up. This entry focuses on the third call to the Scan function. Improving performance bottlenecks posed by the blocking that arises due to disk reads/writes is a separate topic and is not the focus of this entry. The application is profiled in Concurrency Visualizer when scanning ~5000 files, each containing at most a few thousand lines of text, for a reasonably complicated regular expression. Scenario marker "GrepMarker" demarcates the region of interest.
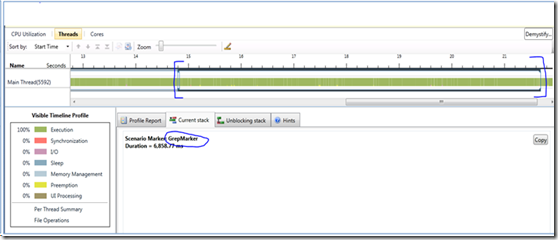
Figure 2: Threads view of the sequential scan region. Irrelevant threads are hidden using the "hide threads" functionality of Concurrency Visualizer. A scenario marker helps zoom in on the important region.
Figure 2 shows the "threads view" after zooming in on GrepMarker region and selecting the marker. As shown in the figure, the region takes ~6.9 seconds and is executing (green) most of this time. Figure 3 shows the CPU utilization view of the same Scan region. As expected, the application fails to use up more than one CPU at any stage, and is compute-bound, resulting in almost a 100% CPU utilization the entire time.

Figure 3: CPU utilization view of the scan region. The application is CPU-bound and might benefit from parallelism to take advantage of available cores.

Figure 4: Execution report of the scan region.
Figure 4 shows the execution report for the scan segment. This shows that almost 75% of the compute cycles are spent in the Regex.Match function, which does pattern matching. The remaining time is spent in reading files, listing directories, in garbage collection, etc. The report shows that there is much potential for improving performance through parallelism. The key is that while the processing on each file is hard to parallelize (it is most natural to read and process lines within a file sequentially), different files can be searched in parallel. Figure 5 shows how to achieve this using PLINQ, by adding a ".AsParallel" directive to the query so that each file is processed in parallel. PLINQ hides away the management required to create threads, partition the work between threads, and collecting the results.

Figure 5: Converting LINQ to PLINQ for parallel performance by adding a .AsParallel directive at the end.
Figure 6 shows the threads view when this parallel version of scan is profiled on the same machine, which is a 4-core system. PLINQ allocates the work to four worker threads, while the main thread processes results as and when they become available. This first attempt at parallelism reduces the time from 6.9 seconds initially to 3.7 seconds, a 1.8x speedup.

Figure 6: Threads view of parallel Scan. The outer marker is the “GrepMarker” scenario marker, while the marker nested inside it identifies the region executing PLINQ code.
The figure also gives insight into why this version did not yield even more speedup. A major bottleneck is the initial sequential portion of the query, which is spent executing Directory.GetFiles, readily identified by examining stacks and execution report for this segment. Another major reason is the load imbalance between the four worker threads, where worker thread 10532 finishes the earliest and thread 9664 finishes the last, delaying completion of the query for almost a second. This is further confirmed by examining the CPU execution view as shown in figure 7. The view clearly illustrates the sequential bottleneck regions that limit gains from parallel performance.

Figure 7: CPU execution view of parallel Scan. Sequential bottleneck regions are circled out.
The initial sequential execution is due to the fact that the call to Directory.GetFiles needs to get the names of all files before it returns an array containing those names. In the sequential version, this operation took only 7.1% of the execution time, but following Almdahl's law, it becomes a limiter to parallel performance. The second sequential bottleneck (circled in the latter part of the region) is due to load-imbalance between the threads executing the query. The load-imbalance problem arises because PLINQ performs range partitioning on the array, assigning equal number of files to each thread, as explained here. This leads to poor partitioning since files are of different length, and require different amounts of processing and simply allocating equal number of files to each partition need not result in a good distribution.
A better parallelization can be achieved by replacing the call to Directory.GetFiles by Directory.EnumerateFiles. This returns an enumerator, and the file enumeration can now proceed in parallel with processing of other files.

Figure 8: Alternative file enumeration strategy for PLINQ based Scan.
Figure 9 shows the result of profiling the resulting version in Concurrency Visualizer, and the region demarcated by scenario marker is selected. In this version, the execution time is ~2.4 seconds which is a 2.9x speedup over the initial sequential version.

Figure 9: Threads view for parallel Scan version 2.
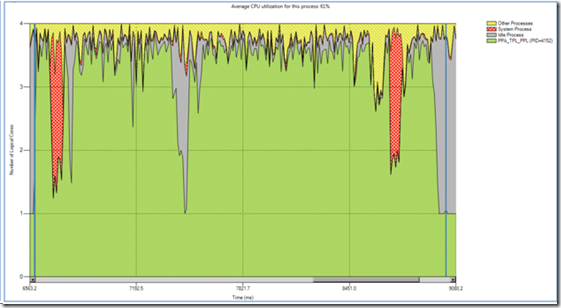
Figure 10 shows the CPU utilization view for this version of scan. Largely, the performance is limited by other processes, or the system doing file system operations on behalf of this application.

Figure 10: CPU utilization view for parallel Scan version 2.
However, there are a few sequential regions that limit even further performance gains. Going back to the threads view, there is non-trivial amounts of blocking. Clicking on such regions gives the detailed blocking stack, as well as what unblocked it. Figure 11 shows the blocking stack for one such region, where three of the worker threads are blocked waiting for the fourth thread. Examining the stack provides some hints into what causes this blocking. The blocking arises due to the chunk partitioning strategy in PLINQ which starts out with a small chunk size, and attempts to grow the chunk size based on application behavior. This particular region was one where the chunk size was increased. Due to this, one thread was enumerating the files and the remaining worker threads were waiting on a lock to be allocated their chunks. This seems to be a one-time thing though, subsequently PLINQ adapted well to the application.

Figure 11: Details of blocking stack for one region in parallel scan version 2.
Figure 12 shows the report summarizing reasons for blocking during this entire period, and file enumeration for chunk partitioning accounts for 0.47 out of the 1.1 second blocked time in the scan period. The remainder of blocked time was spent mainly in garbage collection, something seen by further expanding the report.

At this point, one could spend further time trying to write a custom PLINQ partitioning scheme to reduce the blocking time from chunk partitioning, as well as trying to reduce garbage collection time by selecting a server garbage collector or by using a memory profiler to weed out memory hogs. But already, a 2.9x improvement in performance is quite significant for pretty minimal set of changes to the application code. While changes to code were minimal in this case, Concurrency Visualizer was an important tool in this process to help identify the right set of changes needed and to identify bottlenecks.
Further links:
LINQ:
https://msdn.microsoft.com/en-us/netframework/aa904594.aspx
https://msdn.microsoft.com/hi-in/library/bb308961%28en-us%29.aspx
Parallel Computing
https://msdn.microsoft.com/en-us/concurrency/default.aspx
Parallel Programming in .NET Framework
https://msdn.microsoft.com/en-us/library/dd460693%28VS.100%29.aspx
Parallel LINQ
https://msdn.microsoft.com/en-us/library/dd460688%28VS.100%29.aspx
https://blogs.msdn.com/pfxteam/
Concurrency Visualizer
https://msdn.microsoft.com/en-us/library/dd537632%28VS.100%29.aspx
https://blogs.msdn.com/visualizeparallel/
Mayank Agarwal – Parallel Computing Platform

