Mid-execution Profiling of a Multithreaded Process
In this entry, I will describe how to capture a trace in the middle of a process’ execution for the Concurrency Visualizer, allowing you to visualize the multithreaded behavior of your application during that period of time. This is accomplished by attaching to and detaching from the running process. You may find this to be especially useful in reducing the trace size of a long-running application or to narrow your performance investigation to a known area of interest.
There are two ways to access this feature: via the Performance Explorer and via the Analyze Menu.
The first step is to create performance session. This can be done by clicking the “new performance session” icon in the Performance Explorer (if the performance explorer isn’t visible, it can be found by clicking View->Other Windows->Performance Explorer). You can also create a new performance session if you profile your application through the performance wizard.
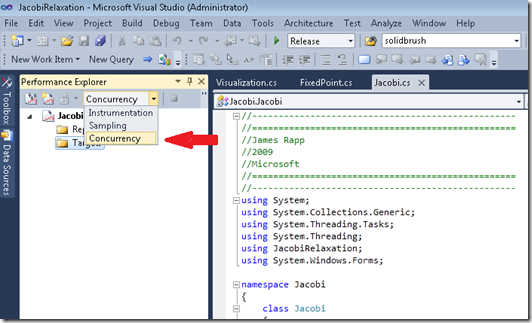
After creating a new performance session, the next step is to select the “Concurrency” option in the performance explorer.
Figure 1: Selecting the “Concurrency” profiling option
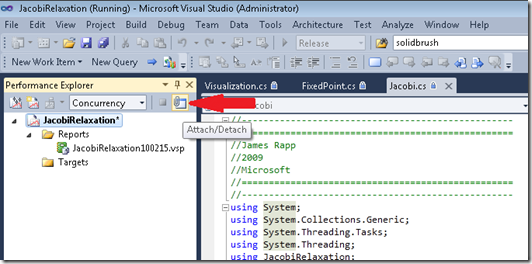
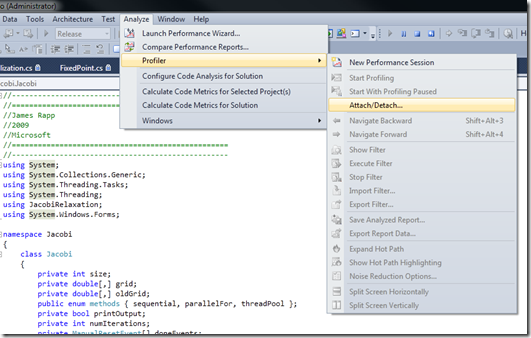
Start your application, either by hitting Ctrl+f5 or by launching the exe outside of Visual Studio 2010. Next, click the “Attach/Detach” button in the Performance Explorer (see figure 2). If you don’t see the “Attach/Detach” button, try widening the Performance Explorer window, as it may be obscured from view. Note that you can also attach to the application via the “Analyze” menu by selecting “Profiler”->”Attach/Detach” (see figure 3).
Figure 2: The attach/detach button within the Performance Explorer
Figure 3: The attach/detach option within the Analyze menu
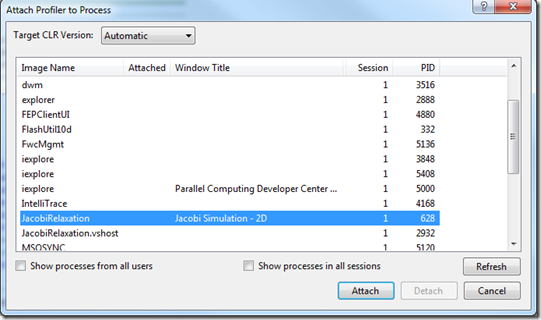
This will bring up a window, which lists all of your processes from the current session. Find your application in the “Image Name” column. The name of the process will be the name of your exe. In my case, the process name is “JacobiRelaxation”.
Figure 4: Selecting a process to which to attach the Concurrency Visualizer
Note: you may see another process with the same name but with the additional “.vshost” after the name. This is the Visual Studio 2010 Hosting Process, which will appear if you are running your application within Visual Studio 2010. The Hosting Process is not the process that you will be interested in profiling, be sure to select the other one.
You may also notice the drop-down menu (at the top of the window) prompting you to select the target CLR version. Note that this is not important to worry about when profiling for concurrency because the Concurrency Visualizer relies on ETW. This only makes a difference when using the other functions of the profiler, namely “Instrumentation” or “Sampling”, since these two aspects of the profiler rely on the CLR profiler. So, it doesn’t matter which option you choose from this drop-down menu.
Once you attach to the process, you can detach in one of four ways:
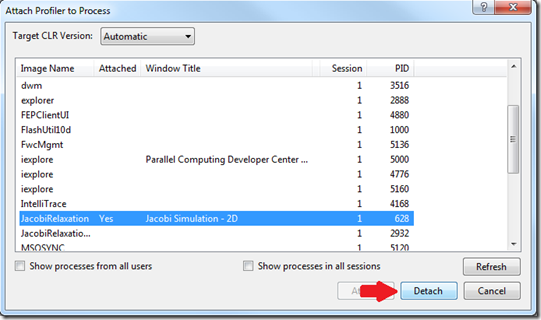
1. Click the “Attach/Detach” button in the performance explorer, find your process in the list, and click “Detach” (figure 5).
Note that when you find your process in the “Image Name” column, “yes” appears in the “Attached” column, indicating that the Concurrency Visualizer is currently attached to this process.
Figure 5: Detaching from the executing process
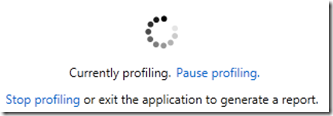
2. Click “Stop profiling” while the Concurrency Visualizer is collecting (figure 6).
Figure 6: The “Stop profiling” option
3. In the Data Collection Control, click the stop button.
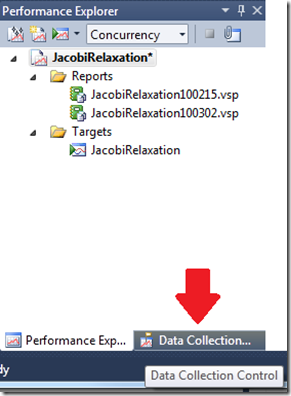
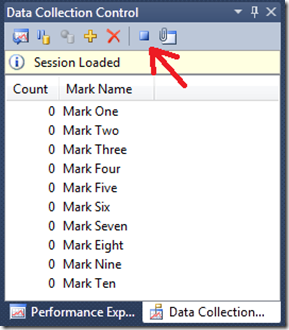
First, you need to click the “Data Collection Control” tab in the Performance Explorer (figure 7). Next, click the “Stop” button in the Data Collection Control (figure 8).
Figure 7: The “Data Collection Control” tab in the Performance Explorer
Figure 8: The “Stop” button in the Data Collection Control
4. Allow the application to terminate on its own (but you already knew this!).
It’s worth noting that although using each of the four methods will cause the profiler to stop tracing, analyze the trace, and present the results, your application will terminate or not terminate depending on which method you choose. If you detach using one of the first two methods, your application will continue to run. If you use the third or fourth method, your application will terminate. Also, keep in mind that you cannot detach from your process via the “Analyze” menu.
I hope you found this helpful! I encourage you to use this feature whenever you are interested in profiling a specific region of execution within a longer-running application.
James Rapp – Parallel Computing Platform
