Learning to Write in Parallel
When I first joined the Concurrency Visualizer team, I thought, “Wouldn’t it be cool to make an application that could write messages on the Threads view?” I wasn’t alone, many of us had thought about it. It turns out to be not so hard.
James wrote about the threads view three weeks ago, so refresh your memory if you need to. On the Threads view, time is on the horizontal axis, and each thread in your application has its own channel on the vertical axis. By creating a set of threads and rigidly controlling their behavior over time, you can control the graphic on the Threads view. Our goal was to create a tool you can use to understand and optimize what your program is doing; the capability to draw pictures is just a fun consequence of accurate measurement.
Learning to write again
To write a letter, we need to first break it up into a grid, similar to the way letters map to pixels on a monitor. We produce a two dimensional array, were 1s represent the foreground, and 0s the background. Here’s the letter “H” in a 3x4 representation:
new int[][] {
new int[] { 1, 0, 1 },
new int[] { 1, 0, 1 },
new int[] { 1, 1, 1 },
new int[] { 1, 0, 1 }
}
We need to use the same number of threads as there are rows in the letter representation. There’s no restriction on how many columns a letter uses, as long as the array is rectangular.
For each row of a letter, let’s use the first row for example (1, 0, 1), we need to translate this sequence of numbers into a sequence of actions for the writer thread to perform. When a writer thread encounters a one, it will perform some spinning operation, attempting to keep the CPU busy for a fixed amount of time. We show execution as green on the timeline, so keeping the thread busy, as opposed to waiting or sleeping will result in a green block.
Stopwatch timer = Stopwatch.StartNew();
int sum = 0;
while (timer.ElapsedMilliseconds < Program.BlockWidth)
{
sum += sum * 50 % 17 << 3;
}
For a zero, a writer thread waits on a shared object using the Monitor class with a timeout equal to the block length (in milliseconds).
lock (this.LetterMonitor)
{
Monitor.Wait(this.LetterMonitor, Program.BlockWidth);
}
After a worker thread has completed a row, it waits on the same monitor object. All writer threads share the same monitor object, and it is used to synchronize all threads before a new letter is started. We use another thread to control the starting of writer threads. The monitor worker thread computes the length of each letter in time (Block Width * Letter Width), adds some spacing, and pulses the monitor object at those time intervals to signal the beginning of a new letter.
Putting it together
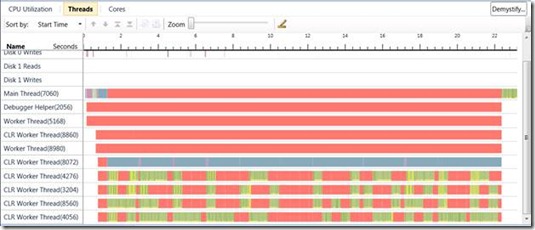
Hopefully you can see quite a lot of what I described above in this picture; I’ll point out some details.
Thread 8072 is our monitor worker thread, notice that it sleeps while each letter is being written, and some addition time for a space, before waking up, acquiring the lock and telling all of the other threads to get busy.
Notice that on the writer threads (4726, 3204, 8560 and 4056), the red segments are solid and contiguous, but the green areas are choppy, and mixed in with yellow. That’s the operating system at work, managing the execution of threads. When there’s a yellow segment in between green, it means we identified a time where the operating system put a thread on hold to let something else run for a while. I took this trace on a 4 core machine, which led me to the choice of letters 4-high. If I had chosen 8, there would be a lot more yellow, as the 8 writer threads fought over the cores.
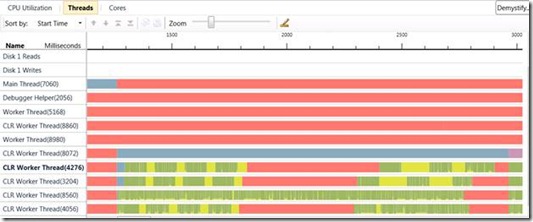
Here’s a close up of the letter “H” from the same run:
Notice how my writer threads don’t start at exactly the same instant? Windows and CLR are doing something there to get my threads ready, but I don’t have any control over how long that takes. Also notice that the red segment in thread 4276 is longer than the others. The Concurrency Visualizer shows me that it’s a full 75 milliseconds longer than I wanted it to be.
Details like this led me to add the shared monitor and monitor worker thread. My initial attempt did not synchronize worker threads after they started, and some threads would get pretty far ahead of others, all for reasons that I couldn’t control. There are so many details to be concerned with in developing concurrent applications; we hope you can use the Concurrency Visualizer to diagnose your performance issues.
Ryan Nowak - Parallel Computing Platform
Comments
- Anonymous
December 01, 2009
Thanks, Ryan! This program makes for a very entertaining demo to wrap up a detailed discussion on visualizing concurrency. After delivering key concepts I like to switch to a profile of this app with a text string relevant to the day, such as "PDC ROCKS!" I start with this app by showing the CPU Utilization view and commenting on the obviously unusual behavior of the app. Then I zoom in on a portion of one of the letter-writing routines because that demonstrates a useful feature and sets up the next step. I then flip to the Threads view, briefly describe what's visible, demonstrate a few more features, dig into call stacks, and show some code. Finally, I refer to the ability to zoom back out to see the big picture, because sometimes that helps put things in context. As I zoom out, suddenly everybody looking at the threads view realizes what we've been looking at. This final visual gets a good response, lightens up a very technical topic, and builds comfort with using the tool. We hope you all enjoy using the concurrency visualizer in the profiler, that you find interesting visual patterns of your own, and that as a result you can more quickly improve the behavior and performance of your multithreaded applications.

