Investigating unresponsive UI issues in WPF: A case study
I was writing a WPF based application which involved some file operations. At times, I observed that the UI was becoming unresponsive. To investigate this issue, I used the Concurrency Visualizer tool (shipped in Visual Studio 11 Developer Preview) to view my application’s execution patterns.
Note that I am using the Concurrency Visualizer SDK. This helps me quickly identify the thread and time interval corresponding to my file compress operation. For details on how to use the Concurrency Visualizer SDK to visualize events in your application, see “Introducing the Concurrency Visualizer SDK”.
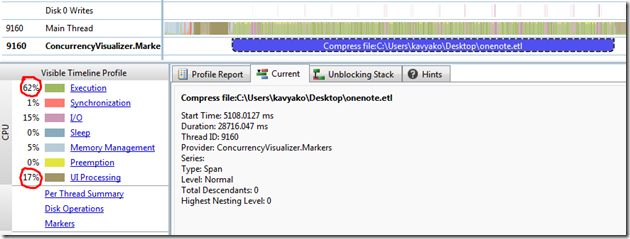
After profiling my application with the Concurrency Visualizer, the following facts are quite clear:
1. Main Thread 9160, which happens to be the UI thread, is spending most of it ‘s time in Execution.
2. No UI processing is happening during the Compress file operation.
During directed testing, this was fine for small files. As file sizes grew compression became a substantial overhead for the UI thread to handle. What this means is that I need to delegate the job of compression to another thread so that the UI thread could remain responsive during compression. This is a good opportunity to try out the new .Net 4.5 Async features.
I quickly moved the compression job onto the ThreadPool using Task.Run. I also changed the Button_Click handler to an async handler, and I await the compression task in Button_Click. When Button_Click gets to the first await, control returns to the caller, thus unblocking the UI thread.
 private async void Button_Click(object sender, RoutedEventArgs e)
{
    await Task.Run(() =>
    {
        // actual Compress code goes here
    });

    // // code to run post Compress // }
Now with this small change, I see that the issue is resolved and I don’t see any unresponsive UI in my application. To confirm this, let us look at the Concurrency Visualizer output:
1. One can clearly see that the Main Thread 4896 is busy with UI processing cycles.
2. Worker Thread 6496 is actually performing the compress operation.
3. Visible Timeline Profile shows that app is spending 50% of the time in UI processing, as opposed to 17% from the first attempt.
You might be wondering about the System.Threading.Tasks markers in the Concurrency Visualizer output. These are from the await and Task.Run operations. They are not enabled by default. To collect the markers for asynchronous operations under System.Threading.Tasks, one needs to change the marker provider level. Goto Visual Studio –> Analyze –> Concurrency Visualizer –> Advanced Settings –> Markers tab.
Select the System.Threading.Tasks provider and click the edit provider icon  .
.
Set the “Collect events with this importance level and greater” to “Low” as shown in the above screenshot. Rerun your application and collect the trace. The Concurrency Visualizer will visualize the System.Threading.Tasks events as markers !!
However, please note that the individual task events can be verbose and cause performance problems. So users should apply some caution when opting to collect these events.


