GC Performance Patterns
Our “Rogues Gallery” is a collection of common, visual patterns exhibiting poorly-behaved multithreaded applications. In this post, I’ll introduce a new pattern: too much pressure on the garbage collector (GC).
When an application creates too many objects, the GC will have to run often, resulting in poor application performance. Because the GC is executing in-process, we can expose this over-activity and diagnose memory management problems with the Concurrency Visualizer. There are three ‘flavors’ of the .NET 4 GC: workstation with background GC, workstation with blocking GC, and server GC. Each ‘flavor’ appears differently to the profiler and will be shown in detail in the following sections.
Workstation with Background GC
By default, managed applications use the workstation GC with background collections. This simply means that ephemeral GCs (Gen0 and Gen1) can be performed concurrently with full GCs (Gen2). Ephemeral collections happen as blocking collections, meaning that they stop your code’s execution and run on your threads. When a Gen2 collection needs to occur, it will execute on a special GC thread that can execute concurrently with the blocking ephemeral collections. Let’s look at an example that puts a lot of pressure on the GC:
Notice that the tooltip on Worker Thread(1728) shows that the thread was started in WKS::gc_heap::gc_thread_stub, this is the special GC thread that handles full GCs (Gen2 collections). You may notice that in some places, the GC thread appears to be executing while the main thread is blocked. This is because the background GC can’t run concurrently during some phases of a collection.
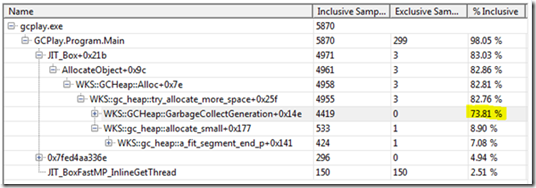
A large amount of execution on the GC worker thread may be indicative of memory management issues and we can investigate further using the profile reports. Because Gen0 and Gen1 collections occur on user threads, the main thread in the above timeline should show it is executing GC code. If we isolate the main thread and look at its execution profile, we see that most of its time is spent in GarbageCollectGeneration:
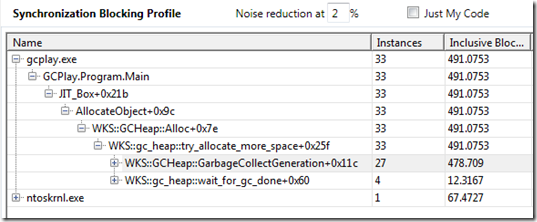
The main thread is in GC code 73.8% of the time it is executing. We can also investigate synchronization segments on the main thread, which shows that even the blocking time is GC-related.
Almost all of the synchronization is due to waiting on garbage collections. Our application’s code is hardly getting a chance to execute, this is clearly a problem. Next steps towards finding solutions will be discussed later.
Workstation GC with Blocking Collections
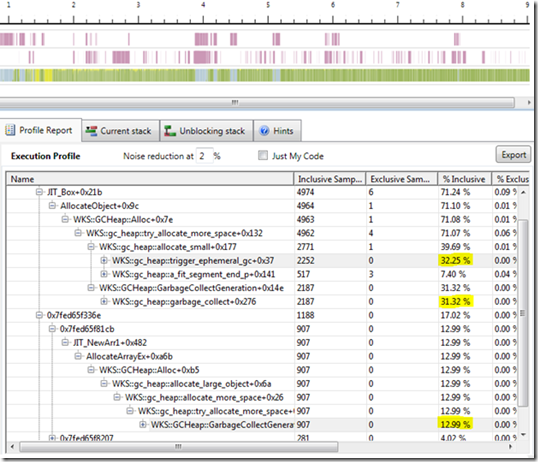
If we were to disable concurrency for the workstation GC and profile the same application as before, we would see a picture like this:
In this example, it’s hard to spot a GC problem from the timeline alone because the Main Thread is executing almost all of the time, which could be a good thing. Because we couldn’t get much information from the timeline, I opened the profile report for this thread. Just as we found with concurrency enabled, the execution profile shows that we’re spending most of our execution time in the garbage collector. If our application had multiple worker threads, it would be even easier to spot GC activity because all other executing threads will be suspended while the GC runs, so you can use the synchronization profile on your worker threads to find garbage collections. Here’s the same program with several worker threads that execute in a loop to demonstrate how the GC will stop them:
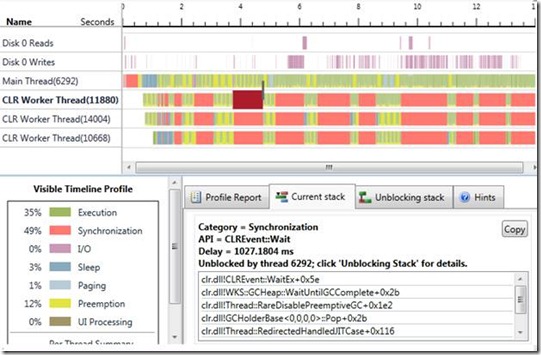
Notice the three CLR Worker Threads are all blocking at the same times. I selected a synchronization segment which shows that it is waiting on WKS::GCHeap::WaitUntilGCComplete with a ready-thread connector pointing to the main thread. The GC needs to stop all threads to perform a non-concurrent workstation GC, so the collection becomes quite apparent in this case.
While the non-concurrent GC makes it easier to spot collections, you probably won’t be using this ‘flavor’ in practice.
Server GC
Now that we’ve seen how the workstation GC can be exposed using the Concurrency Visualizer, lets profile the original application with the server GC enabled:

Hovering over the four worker threads shows that each thread started in SVR::gc_heap::gc_thread_stub, the server GC creates one of these threads with its own heap for each core. When a GC is triggered, all user threads are stopped and each thread concurrently collects in its own heap. Just like workstation GC with concurrency disabled, the server GC makes it particularly easy to identify collections. This picture shows us clearly where collections are occuring because there are executing segments on the GC threads while the main thread is blocked. We can see that approximately half of the total profiled time is spent executing GC code—clearly the application isn’t performing very well. While the timeline is helpful for quickly identifying patterns, we can verify this by isolating the main thread and looking at its profiles:
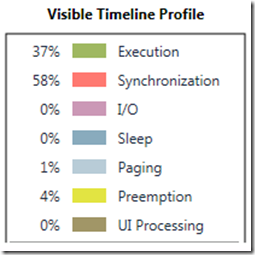
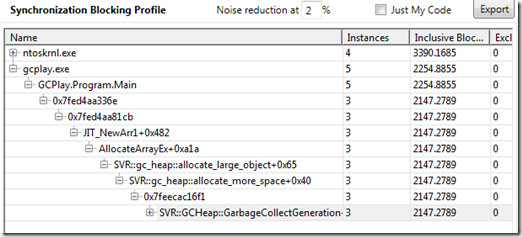
Notice that 58% of the profiled time of the main thread is spent waiting on synchronization, most of which is in SRV::GCHeap::GarbageCollectGeneration. As with the workstation GC (with both concurrency enabled and disabled), we’ve identified a problem where the user’s code isn’t running very often due to a heavy GC load.
The Memory Management Problem
Using the Concurrency Visualizer, we’ve seen how this performance problem manifests itself using each ‘flavor’ of the GC.
Unfortunately, there isn’t a simple solution to this problem, but there are a few next steps to take:
1. Use a managed memory profiler to find what is being allocated, where it is allocated, and why objects are kept alive that you expect to be collected. A good profiler can take ‘snapshots’ to see how the managed heap has changed over some period. Some memory profilers you may consider using are: CLR Profiler (Microsoft), Visual Studio .NET Memory Allocation Profiler, .NET Memory Profiler (SciTech), ANTS Memory Profiler (Red Gate).
2. Learn about memory management and the .NET GC. Read the MSDN Documentation, Maoni's Weblog, and Rico Mariani's article on GC Basics. Understanding the GC will help you write code which can be better managed by the CLR. In some cases, you can gain some performance by switching GC ‘flavors’, just make sure you understand the differences before doing so.
Matt Jacobs - Parallel Computing Platform

