Azure Log Analytics: Service Level Agreement (SLA) part 1
This week there was a good discussion on how to show an SLA view in Log Analytics, which was similar to a feature in System Center Operations Manager, the output and query I’m sure will be useful for others.
Basically what was required was an SLA view of a service, where the service was made up of a few computers and multiple SLA thresholds were needed to be checked.
Credit to my colleague Christoph for a lot of the code used in this SLA example, his blog is here:https://blog.peterschen.de/
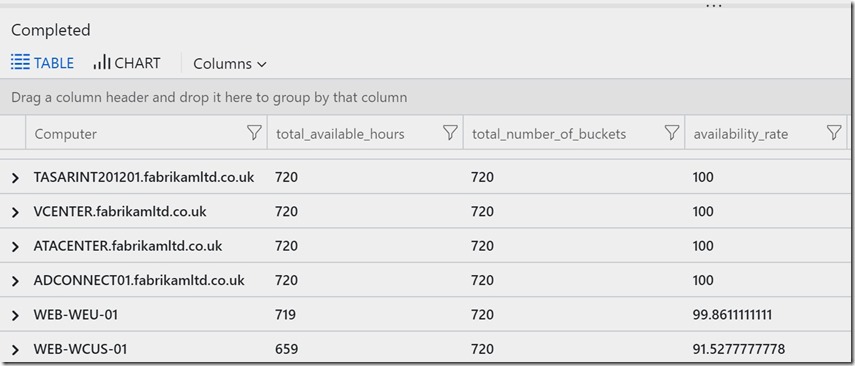
The first part of the SLA solution was looking at the Heartbeat info
Let start_time=startofday(ago(30d));
let end_time=startofday(now());
Heartbeat
| where TimeGenerated > start_time and TimeGenerated < end_time
| summarize heartbeat_per_hour=count() by bin_at(TimeGenerated, 1h, start_time), Computer
| extend available_per_hour=iff(heartbeat_per_hour>0, true, false)
| summarize total_available_hours=countif(available_per_hour==true) by Computer
| extend total_number_of_buckets=round((end_time-start_time)/1h)
| extend availability_rate=total_available_hours*100/total_number_of_buckets
| order by availability_rate desc
Basically this query looks back 30days, and checks the Heartbeat data for any missing info and calculates a % availability from it. for all Computers.
Please note using Heartbeat is only an SLA indicator, there is a potential for the server to still be up and working correctly but the Heartbeat not working, likewise Heartbeat can be sending data when the server workload might not be working correctly.
Requirements
In the case being discussed we had some other requirements to meet:
1. To show CPU data in the SLA
2. To show Memory data in the SLA
3. To alert on specific thresholds for CPU, Memory and availability
4. Only monitor a specific set of servers that made up a “service”
5. To also show an overall SLA health – good or bad
The final query ended up like this, I’ll break it down into sections afterwards:
let start_time=startofday(ago(30d));
let end_time=startofday(now());
// Add my SLA values
let serviceName = "AKScluster";
let AVAILsla = 90;
let CPUsla = 50;
let MEMsla = 90;
// get server list from heartbeat
let hbav=Heartbeat
// find my 3 servers for my service, they happen to start with "AKS"
| where Computer startswith "aks"
| where TimeGenerated > start_time and TimeGenerated < end_time
| summarize heartbeat_per_hour=count() by bin_at(TimeGenerated, 1h, start_time), Computer
| extend available_per_hour=iff(heartbeat_per_hour>0, true, false)
| summarize total_available_hours=countif(available_per_hour==true) by Computer
| extend total_number_of_buckets=round((end_time-start_time)/1h)
| extend availability_rate=total_available_hours*100/total_number_of_buckets
| order by availability_rate desc;
// CPU details
let cpuutil=Perf
| where TimeGenerated > start_time and TimeGenerated < end_time
| where ObjectName == "Processor"
| where CounterName == "% Processor Time"
| where InstanceName == "_Total"
| summarize CpuUtilization=avg(CounterValue) by Computer;
//MEMORY details
let memutil=Perf
| where TimeGenerated > start_time and TimeGenerated < end_time
| where ObjectName == "Memory"
| where CounterName == "% Used Memory"
| summarize MemUtilization=avg(CounterValue) by Computer;
hbav
| join kind= inner (cpuutil) on Computer
| join kind= inner (memutil) on Computer
// show the status of my service
| summarize
Name = serviceName,
avg(availability_rate),
availabilitySLA = iif(avg(availability_rate) < AVAILsla, "Bad","Good"),
avg(CpuUtilization),
cpuSLA = iif(avg(CpuUtilization) > CPUsla, "Bad","Good"),
avg(MemUtilization),
memSLA = iif(avg(MemUtilization) > MEMsla, "Bad","Good"),
ComputerList = makeset(Computer),
dcount(Computer)
How did we achieve the SLA info
At the top of the script I added some variables for the ServiceName and the defined SLA thresholds.
In this case we wanted alerts to show when:
- The overall SLA was below 90% ,
- average CPU usage was above 50%
- average Memory was above 90% .
I had 3 servers in an AKS cluster that I used, but you could amend the line to filter on your own service and list of computers. I used startswith “AKS”, please adapt for your own naming convention.
// Add my SLA values
let serviceName = "AKScluster";
let AVAILsla = 90;
let CPUsla = 50;
let MEMsla = 90;
// get server list from heartbeat
let hbav=Heartbeat
// find my 3 servers for my service, they happen to start with "AKS"
| where Computer startswith "aks"
We then added two sections to get the CPU and Memory info from the Perf Log Analytics table and Join those to theHeartbeat table.
Here are the lines for CPU, you can see it uses the same timespan set earlier and can easily be changed for any other relevant Perf counter. The Memory info was a copy of this with a few changed values.
// CPU details
let cpuutil=Perf
| where TimeGenerated > start_time and TimeGenerated < end_time
| where ObjectName == "Processor"
| where CounterName == "% Processor Time"
| where InstanceName == "_Total"
| summarize CpuUtilization=avg(CounterValue) by Computer;
The JOIN operator was used to link the data with the Heartbeat – again an amended line was repeated for memory join.
| join kind= inner (cpuutil) on Computer
All we needed then, was to display the data. You can do this in many ways but I chose the Summarize operator and some IIF functions.
| summarize
Name = serviceName,
avg(availability_rate),
availabilitySLA = iif(avg(availability_rate) < AVAILsla, "Bad","Good"),
avg(CpuUtilization),
cpuSLA = iif(avg(CpuUtilization) > CPUsla, "Bad","Good"),
avg(MemUtilization),
memSLA = iif(avg(MemUtilization) > MEMsla, "Bad","Good"),
ComputerList = makeset(Computer),
dcount(Computer)
In this example I used words to denote when an SLA wasn’t reached i.e. Good or Bad. If you plan on raising an Alert from this you could change these to a 0 or 1 to enable an alert to trigger on a threshold change.
So in the above example I got the value of the SLA and used IIF to display the words “Bad” or “Good” depending on the value compared to the variables we defined at the beginning on the script with the LET operators.
Note: there is also a count of the computers and a list of the computer names , but I haven't shown that in the above screen clip, to keep it readable on the page
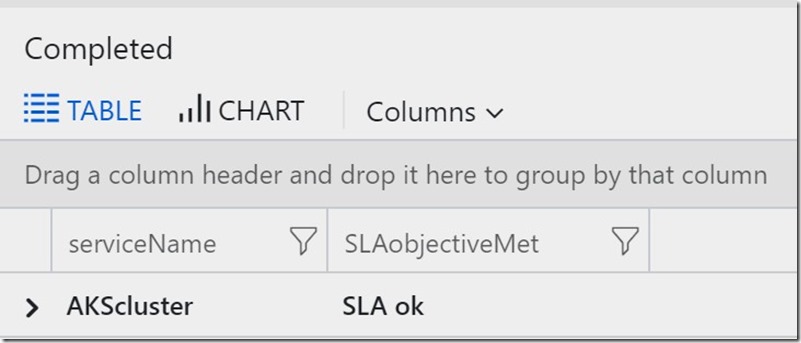
For the final requirement of an overall SLA health
| extend SLAobjectiveMet = iif( availabilitySLA == "Good" and cpuSLA == "Good" and memSLA == "Good" , "SLA ok","SLA Not Ok")
| project serviceName, SLAobjectiveMet
I used an another IIF to link all three results, so if all 3 individual SLAs were ‘good’ - then the overall SLA was ‘SLA ok’.
Again you could use a 0 and 1 for generating Azure Alerts.


