New Showplan enhancements
If you follow this blog, you have seen that in the past few releases we have continuously included a number of diagnostic improvements to Showplan. You can read about some of them here.
Looking at the actual execution plan is one of the most used performance troubleshooting techniques. Having information on elapsed CPU time and overall execution time, together with session wait information in an actual execution plan allows a DBA to use showplan to troubleshoot issues away from the server, and be able to correlate and compare different types of waits that result from query or schema changes.
A few months ago we had introduced exposed in SSMS some of the per-operator statistics, such as CPU and elapsed time per thread. More recently, we have introduced overall query CPU and elapsed time tracking for statistics showplan xml (both in ms). These can be found in the root node of an actual plan. Available using the latest versions of SSMS v17, when used with SQL Server 2012 SP4, SQL Server 2016 SP1 and SQL Server 2017. For SQL Server 2014 it will become available in a future Service Pack.
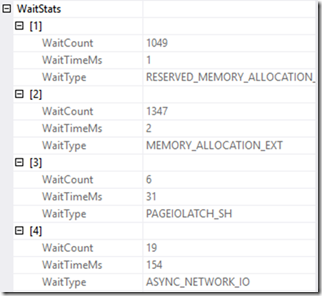
And also included the top 10 waits that the execution was waiting on (includes WaitType, WaitTimeMs and WaitCount), based on sys.dm_exec_session_wait_stats. Most common sleep and idle waits are filtered out from the actual plan, so that it becomes easier to really see the relevance of non-idle waits for query performance.
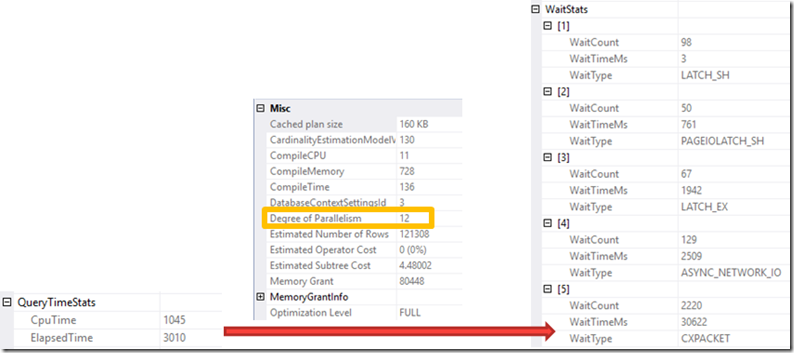
This allows a user to correlate waits with overall times, and be more precise in what to look for to improve query performance. For example, in the picture below, I can correlate the overall elapsed time with the top waits, see that CXPACKET were the most prevalent, that this query is running with DOP 12, and choose to reduce DOP as a way to address this (among other actions possible).
Available using the latest versions of SSMS v17, when used with SQL Server 2016 SP1 and SQL Server 2017. Note that CXPACKET wait will be available in showplan with SQL Server 2017 CU3 and 2016 SP2.
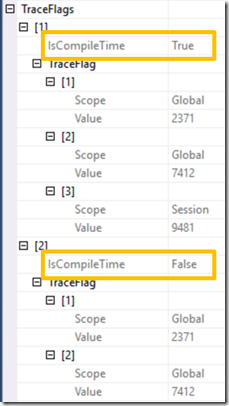
One other information you can now find in showplan is trace flags. This is relevant to understand what trace flags are active during compilation, and which one (if any) actually influence compilation. Below we can see trace flags 2371, 7412 and 9481 were active during compilation (IsCompileTime = True), but 2371 and 7412 did not influence the Query Optimizer (IsCompileTime = False). You can see more information on these trace flags and others in https://aka.ms/traceflags.
These can be found in the root node of even an estimated plan, given this is a compile time information. Available using the latest versions of SSMS v17, when used with SQL Server 2012 SP4, SQL Server 2016 SP1 and SQL Server 2017. For SQL Server 2014 it will become available in a future Service Pack.
Pedro Lopes (@sqlpto) – Senior Program Manager
Comments
- Anonymous
November 08, 2017
This is great to have. One small question: Why are the waits sorted in ascending order by wait time? (The shortest of the top 10 waits, based on WaitTimeMs, shows up as wait [1].) This was confusing since most people would expect the wait types to be sorted in descending order by wait time.We're happy to see all of these showplan improvements. Thank you!- Anonymous
November 08, 2017
Thank you Geoff. Can you please open a connect item to gauge the interest in changing the sort order for waits?- Anonymous
November 09, 2017
Here's a Connect item: https://connect.microsoft.com/SQLServer/feedback/details/3143939The Connect item asks for two things:(1) Make sure that showplan is actually reporting the top 10 wait types. As is, the sort order implies that it's actually reporting the bottom10 wait types. If this is true, for queries that encounter more than 10 wait types, the top (highest WaitTimeMs) wait types will not appearin the top 10 list.(2) Present the wait types in descending order by WaitTimeMs. Since the goal is to show the top 10 wait types, the order should showthe top wait type first rather than last.- Anonymous
November 10, 2017
Let me also clarify that you are seeing the top 10 waits, but then the top 10 taken from session stats DMV are ordered ASC, and as I understand it, the request here is to change to DESC.
- Anonymous
- Anonymous
- Anonymous
- Anonymous
November 08, 2017
Is this for SQL 2017?- Anonymous
November 08, 2017
No, this is available in SQL Server 2016 as well, using the latest versions of SSMS. Mind the note on CXPACKET waits at the bottom of the page.
- Anonymous
- Anonymous
November 08, 2017
it is good improvements but only for 2016,2017. Most of our customers are using the lower version.- Anonymous
November 09, 2017
Not all, for example, overall CPU and elapsed time is available on SQL Server 2012 with latest SP4, and using v17 SSMS.- Anonymous
November 09, 2017
I've added version information for each enhancement in this post.
- Anonymous
- Anonymous
November 09, 2017
Resul, can you please reach out to me sunila@microsoft.com. I want to get your input on how to move customers from older version of SQL ServerThanksSunil
- Anonymous
- Anonymous
January 31, 2018
What does it mean when I only see one set of trace flag information? Meaning I only have "IsCompileTime=True" and both trace flag I used listed there. Does that mean both were active during compilation and both influenced that plan?- Anonymous
May 25, 2018
Sorry for the delayed reply. The list under IsCompileTime = True means all TFs that were present at compile time. From this, the list under IsCompileTime = False is the subset (if any) that did NOT affect the query compilation process.
- Anonymous


