VSTS 2010 Feature: Load test virtual user activity visualization
This is another post about new VS 2010 web/load testing features. You can get the beta here: beta download
In this post I am going to talk about a new load test feature called “Load test virtual user activity visualization”. This feature is a new way to look at load test data. In this feature we will provide a look at what users are doing during a load test. It will help answer the question, “I see a spike in CPU or a drop in requests/sec, what tests or pages are running during this spike or drop? Also are they passing or failing?”. Prior to VSTS 2010, we could answer this question, but not easily. Now you will be able to just right click on a graph in the load test analyzer and select Go to User Detail.
Configuring Load Test to Collect Full Details
In order to show the detail view, you need to configure your load test to collect full details. In this mode we collect detailed information about every test, page and transaction. This option was available in VS 2005 and VS 2008, but once the data was collected, the only way to access this info was by SQLqueries. In VS 2005 and 2008 this was not the default behavior. In VS2010, the default behavior is to collect full details. If you are upgrading a VS 2008 or 2005 load test, do the following to enable full detail collection.
1) Open the load test in the load test editor
2) Click on the Run Settings node
3) Bring up the property browser
4) Click “Timing Details Storage” and select “All Individual Details”
Accessing User Detail View
The user detail view is only available once the test is complete. After the test finishes, you will see the following dialog:
Choose Yes to enable the post run options. There are 2 ways to get the user detail view. First you can click the User Detail button on the toolbar.
Or you can right click on a graph and select “Go to user detail”. If you use this option, the user detail view will auto zoom to the part of the test that you right clicked on. So if you click on about the 30 second mark, then the detail view will have the 30 second mark plus/minus another number of seconds.
User Detail View
Main Screen
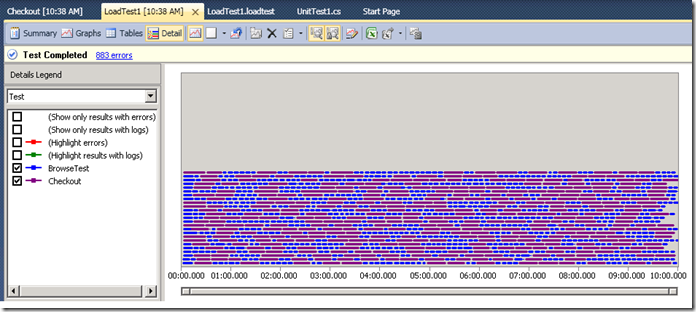
I executed a load test with 2 web tests that access the IBuySpy website. One test just browses the site and the other will browse and place an order. The tests also have transactions. The load test has 25 users executing tests for ten minutes. When you access the user detail view you will see the following:
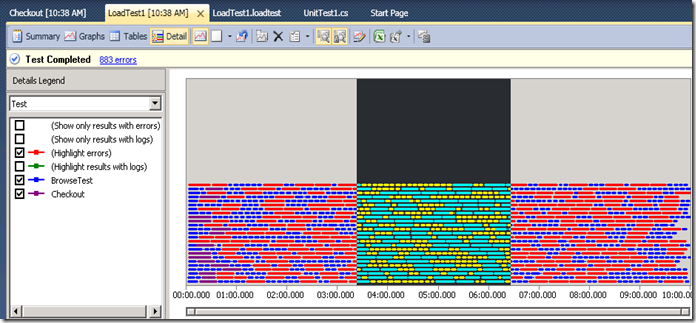
Let go over what you are looking at. Each horizontal row represents a virtual user in the test. Each line in a row represents one unit of whatever you are currently looking at: Test, Page, or transaction. By default the initial view will display test. So each line in the row represents a test. The length of the line represents the duration of the test and the color represents which test was executed. Look at the legend on the left to see what each color represents.
Legend
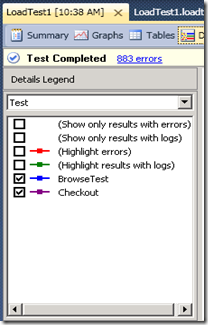
Now let’s go over what is in the legend. Here is what it looks like:
At the top of the legend is a combo box that lets you choose what type of result you want to look at: Test, Page or transaction. Change the combo to have the view refreshed into a new result type. The first 2 options below the combo are “Show only results with errors” and “Show only results with logs”. If you check Show only results with errors, the graph will remove successful results. This can be useful, because you might see that one test is failing often during time that tests/ sec drop or CPU spikes. This is what this looks like when selected:
As you can see, when this happens you are left with just checkout tests. So this indicates that the browse test seems to be working, but there appears to be a problem with the checkout process.
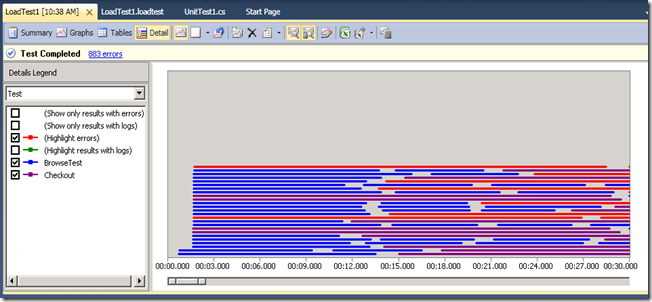
The next 2 options are “Highlight Errors” and “Highlight results with logs”. Many times the tests that are causing errors will cause the spike in cpu. Or maybe you will notice that a certain test fails while another test is running or immediately after another test has executed.
When you click highlight errors, each test that failed will be turned red. This will help you get an idea of what tests are failing and it might show a pattern that indicates why a certain condition such as a spike in CPU is occurring. Here is what this looks like:
This now shows us which tests are failing, but it also shows us that there are Checkout tests which are passing. So now we know that the checkout process sometimes works, but when we run it under load, it will also fail.
The other option is highlight tests with logs. If you select this, each test that has as test log will be turned green. This will show you tests that you can get additional information on. Check out this blog for how to enable test log collection: Test Log Collection.
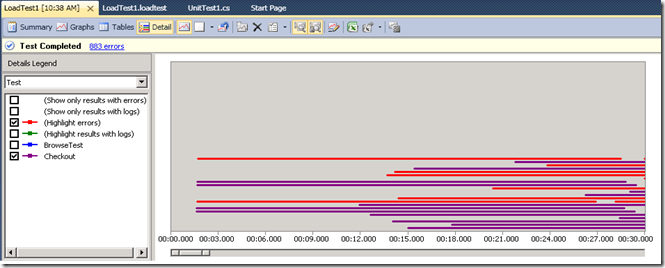
Next you will notice that each test/transaction/page has a check box next to it. If you uncheck the check box, that test/transaction/page will be removed from the view. For example,
I unchecked the Browse test, so now I see just Checkout tests.
Tooltips
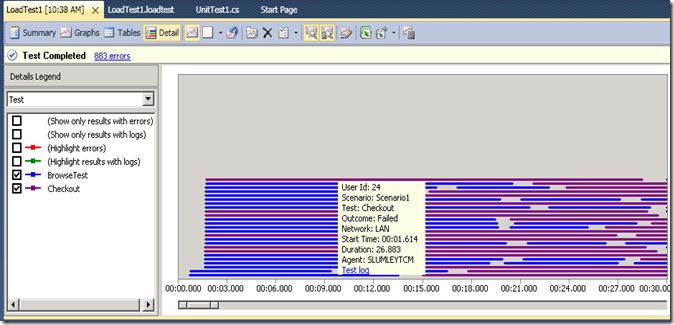
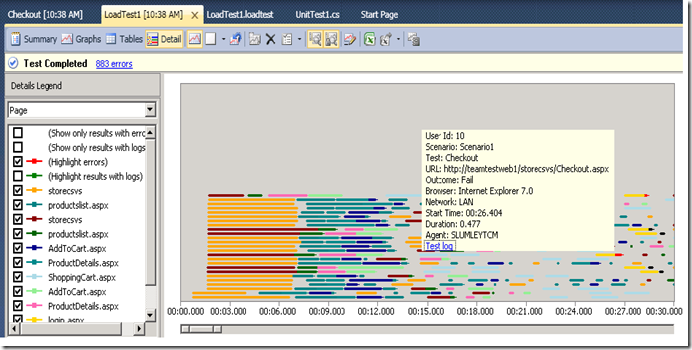
Another nice part of this view is that you can get very detailed information in a tooltip by hovering a line. For example, when I hover the top line in the view, I see the following:
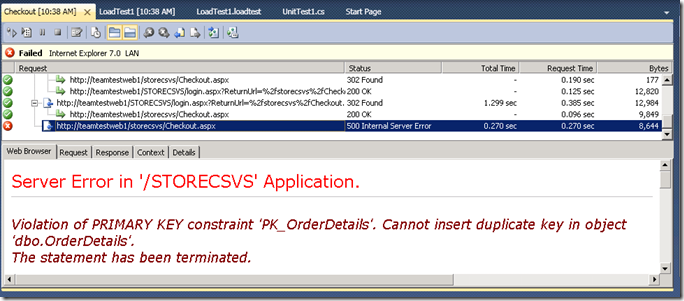
As you can see, you get information about the user, scenario, test, outcome, network , start time, duration and machine executed on. Also if there is a test log associated with the result, you will see a hyper link with test log. If you click the test log hyper link, the log for that test will appear. For a web test, the web test result will be opened in the web test playback UI. If it was a unit test, you will have the unit test result viewer opened. For example if I click on the above hyper link, I see:
So now I can get the full web test result and can see the failure. So my checkout test hits a primary key violation during the checkout request. So this is really nice when you click highlight errors, hover a result with an error and then pull up the failed test.
Here is what the tooltip looks like if I hover a page. You can see from here that you get the URL as well as what browser was being emulated. Also you can drill into the test log for the page if a log was collected
Scrolling and Zooming
You may have noticed the scroll/zoom bar at the bottom. This works exactly like the scroll/zoom bar on the regular graphs. You can scroll through different test intervals and zoom down to one sample interval or expand it to show the entire test. For example, here is my entire test run.
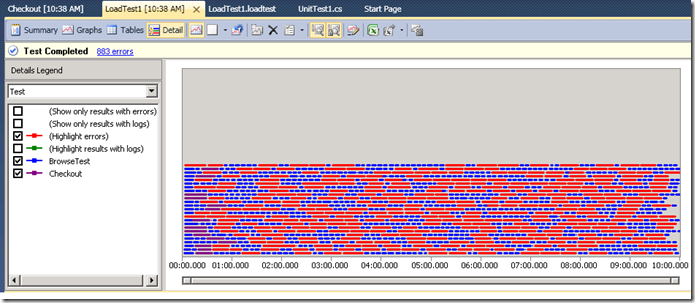
This gives you the 10,000 foot view of what is happening in your test. For example, you might see a particular iteration of a test that takes much longer than other iterations of same test. Again you can highlight errors and see the following:
This shows me that my checkout tests passed initially and then they all failed.
You can also highlight a part of the view and zoom to that area. So if I highlight the following:
Then my graph will automatically zoom to this area.
You will also see a vertical scroll bar if there are too many users to display on the window.
Try it out and let us know how you like it
I will follow this post up with other examples of how to use this view and what patterns you may see, such as deadlock type problems. But hopefully you see the value in now being able to answer the question of what is happening at a certain point in the load test. You can quickly jump to the user detail and see the tests/pages/transactions, then even pull up a test log for the part of the test you are looking at. Please provide feedback once you have a chance to try this out.
Technorati Tags: VSTS,Web Test,VSTS2010,Visual Studio 2010
Comments
Anonymous
June 11, 2009
Beta 1 was released to the web today for MSDN subscribers. If you are a MSDN subscriber, you can downloadAnonymous
December 27, 2010
Scenario: I create the web test for creating new user with registration form. Then I create 30 records of new user with different data at access/excel file Now I want to create the Virtual users total 30. each virtual Now I data bind the access/excel file with web test. I want to run all these 30 users simultaneously and can get the data from access/excel file on same time and complete the scenario in one iteration. how I can do it? Regards, Tufail tufailfifa99@gmail.comAnonymous
November 04, 2011
(Y) thumbs up, it was very knowledgeable and informative, thanks a bunch for sharing it.Anonymous
November 29, 2011
how can i get the details of individual users showed in the tooltip. i want that information in excel or in any file ..is it possible to retieve those individual users?Anonymous
March 21, 2012
THanks for the good explanation of the topicAnonymous
May 14, 2013
Hi iam new for VSTS , While running my script shows below error, i am unable to solve this issue. plese do the need ful solution. Request failed: Context parameter '$HIDDEN1.wa' not found in test context and 404 error . please give guidance in this issue. Thanks in Advance


