Trendlines (Calculated Series) in Reporting Services Charts
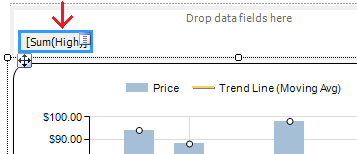
One of the new chart features in Reporting Services 2008 is the ability to add chart series calculated from another series. This is accomplished by right-clicking an existing series (data point value) and selecting "Add Calculated Series ..." from the popup menu.

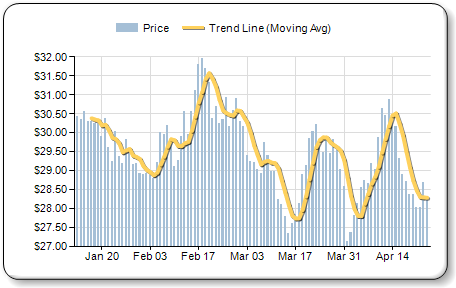
You can choose from a variety of pre-defined and parameterized formulas for the derived chart series. This includes Bollinger bands, several types of moving average calculations, detrended price osciallator, mean, median, relative strength index, MACD, TRIX, and more. The attachment of this posting contains a small report (data are included in the report) that shows a simple moving average price trend line. The rendered chart is shown below.
