Analyzing LinkedIn Connections using Spatial Query!
Let me confess before I even start! I am an hardcore LinkedIn fan. I love to connect with people who have a similar passion for Technology,Share my thoughts and learn from others experience.
As all of you might know,I am an Analytics Guy ![]() and always intrigued by numbers. This led me to understand my connections in LinkedIn. In the process I saw an graph which was absolutely stunning and tickled my brains to do some work to replicate the same in SQL Server Reporting Services. I always believed and still believe that SQL Server can do anything! absolutely anything. It’s just that you know how to use it
and always intrigued by numbers. This led me to understand my connections in LinkedIn. In the process I saw an graph which was absolutely stunning and tickled my brains to do some work to replicate the same in SQL Server Reporting Services. I always believed and still believe that SQL Server can do anything! absolutely anything. It’s just that you know how to use it![]() .
.
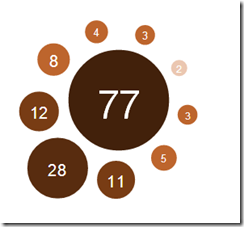
Below was the chart which made me wear my thinking hat!
So, what’s so intriguing about it? Yeah, it looks more like a scatter plot chart with varying size depending on the measure? hmmmmm…….
Here is the catch, You need to have the largest circle(Of course it has highest radius!) in the middle and rest of the circles surrounding it with appropriate radius. Here, I have the highest connection with a company X which has around 77 connections in the middle.
Well, Its not that tough when you know SQL Server spatial will solve your problem to create such a intriguing chart.
Enough of background! So, How was it done?
- Created a function which will return the point co-ordinates of each location within equal interval depending on the number of companies.
- Created a function which will return the radius of each circle depending on the measure size.
- Created a SSRS report to do the final touches

Here is the output in SQL Server and after little bit of tinkering the output in SSRS :
I have uploaded the scripts and Reports in my skydrive. Feel free to download and showcase this to your client and partners.
Happy reading and enjoy the weekend.

