Using the keyboard to profile an application (Alt-F2 shortcut)
In announcing Visual Studio Beta 2 profiler features, Chris mentioned that we have a new option on the Debug menu called ‘Start Performance Analysis’ which has the Alt-F2 keyboard shortcut. This makes it easier than ever to start profiling your application. The new menu item has the following behavior:
- You must have a Visual Studio Solution open in order to enable it.
- If you have a solution open, but do not have a launchable current performance session, Start Performance Analysis launches the Performance Wizard.
- If you have a solution open and have a launchable current performance session, Start Performance Analysis starts profiling.
Let’s use this new functionality to profile an application that I have prepared earlier.
- Open the solution with ‘Alt-F, J, Enter’:

- Start Performance Analysis with ‘Alt-F2’, which brings up the wizard:
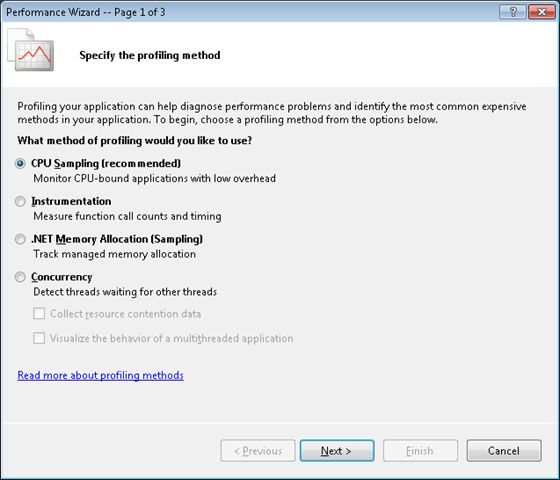
- Press ‘Enter’ to choose the default ‘CPU Sampling’ profiling method and move to the target selection page:
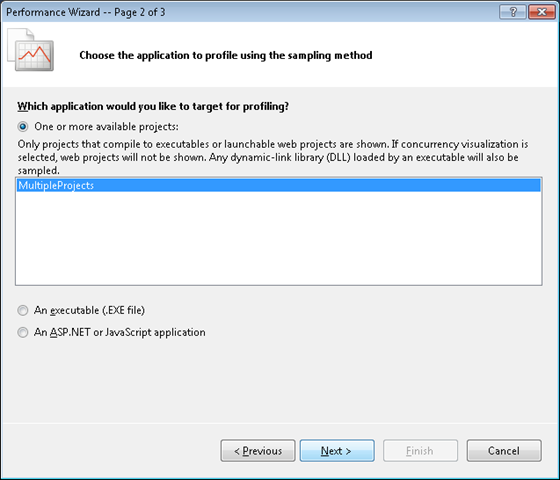
- Press ‘Enter’ to select the only launchable project in the solution and move to final wizard page:
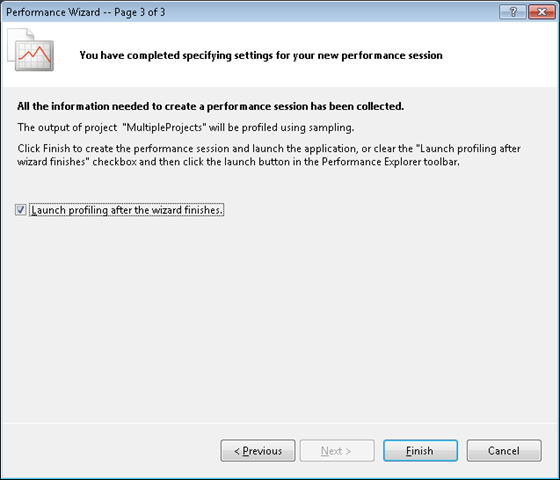
- Press ‘Enter’ to finish the wizard and start profiling:
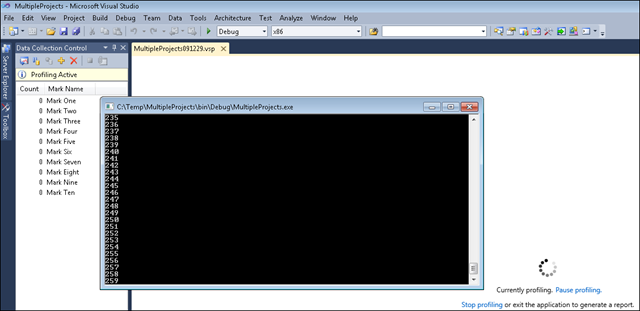
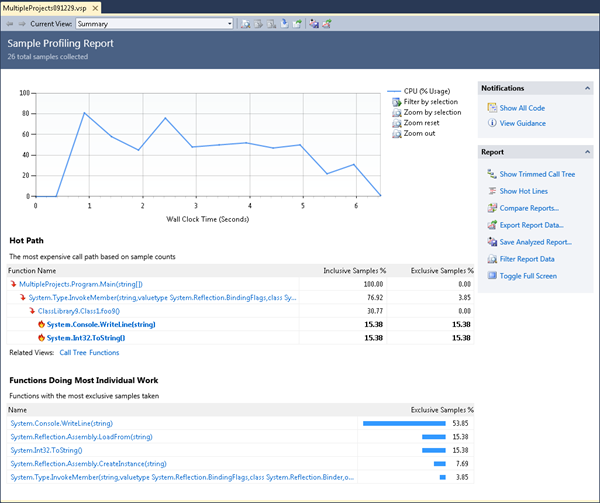
- The report will open when profiling finishes:
If you wish to profile again, selecting Alt-F2 will start profiling with the Performance Session that was created after step #4.