Use Visual Studio 2012 to debug JavaScript code outside the running project
In this article, we will share a Visual Studio debugging tip for debugging JavaScript files that are outside apps for Office projects—for example, a JavaScript file built from multiple source files in the project, or a JavaScript file hosted in the cloud. We will use the Wikipedia app for Office (available on GitHub) as an example.
Note that for normal (non-dynamically loaded) JavaScript files, you could just place the breakpoints in the source files. The breakpoints will be synchronized with the breakpoints in the running app.
The Wikipedia app for Office has an iFrame loaded as part of the sandbox.html page. The sandbox.html page and its scripts are hosted in a sandbox domain, which is isolated from the app domain where the file Wikipedia_dev.html is hosted. The app domain is the place that the local Internet Information Services (IIS) Express starts. The sandbox.html and sandbox.js are loaded during run time when the app is started.
Download the source code
The Wikipedia app for Office is an open-source project. You can download the source code from Wikipedia App for Office source (GitHub) .
Debug the Wikipedia app for Office
- Open the project in Visual Studio 2012.
- Click the Start button to debug the project.
 Figure 1. Wikipedia solution in Visual Studio 2012
 - Word 2013 starts, and the Wikipedia app for Office is loaded.
 Figure 2. Load the Wikipedia app for Office in Word
 - Switch back to Visual Studio. In Solution Explorer, open the JavaScript file sandbox.js.
 Figure 3. Open the JavaScript file sandbox.js
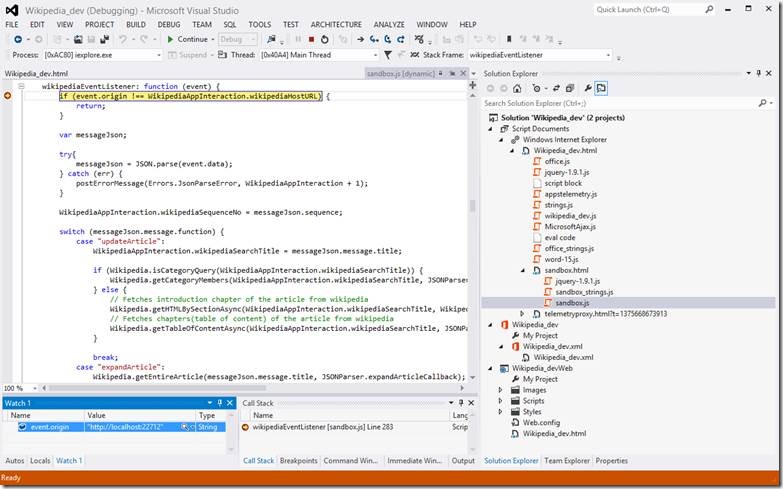
 - Insert a breakpoint in sandbox.js that is loaded during run time. For example, if we want to debug the wikipediaEventListener function, we insert a breakpoint in that function.
 Figure 4. Insert a breakpoint in the JavaScript file sandbox.js
 - Trigger the breakpoint from the Wikipedia app for Office UI.
The execution is paused at the breakpoint. We can see the value of event.origin in the Watch 1 window. Its current value is the domain where the Wikipedia app is hosted. Figure 5. Debug the JavaScript file sandbox.js
Debug apps for Office using the DOM Explorer
Debugging the JavaScript script is only half of the debugging story. The other half is debugging the app’s Document Object Model (DOM) via the DOM Explorer pane in Visual Studio (requires Internet Explorer 10 or higher). For more information on how to start the DOM Explorer, see Tip #4 (bottom of the page, under “Tips & Tricks”) of Building great-looking apps for Office using the new project templates.
References
Attribution
This article was written by Microsoft ecosystem team’s SDET Tao Wu and content publisher Tony Liu. Program manager Michael Zlatkovsky provided valuable feedback.