Breakpoint Configuration Improvement, Debugging support for LINQ and Lambda expressions and PerfTips in Visual Studio 2015
In this post we will see some of the debugging improvements like configuration enhancements when setting break points or conditions, executing LINQ and Lambda expressions through Immediate or Watch windows and performance tips to get quick information about the time taken to execute particular block of code or statement in Visual Studio 2015.
Configuration Improvement
With Visual Studio 2015 you can customize break points through a peek window. With earlier versions, there were separate dialogs for configuring Hit Counts, Conditions etc. With Visual Studio 2015 we can configure them through a peek window. Break point configuration window is divided into two categories i.e. Conditions and Actions. Through this, it is quite easy to enable/disable or modify conditions and actions quickly. Also, if you delete your break points, you can undo them by hitting Ctrl + Z and it reverts to the conditions or actions configured earlier.
Following snapshot showing a settings icon appear after putting a breakpoint
You can set conditions either through a Conditional expression, Hit count or Filter
Debugging support for LINQ and Lambda expressions
This is the most exciting feature I found where you can provide LINQ and Lambda expressions on collections through Immediate or Watch windows. Before Visual Studio 2015 there was no option to apply these expressions and filter in debug mode.
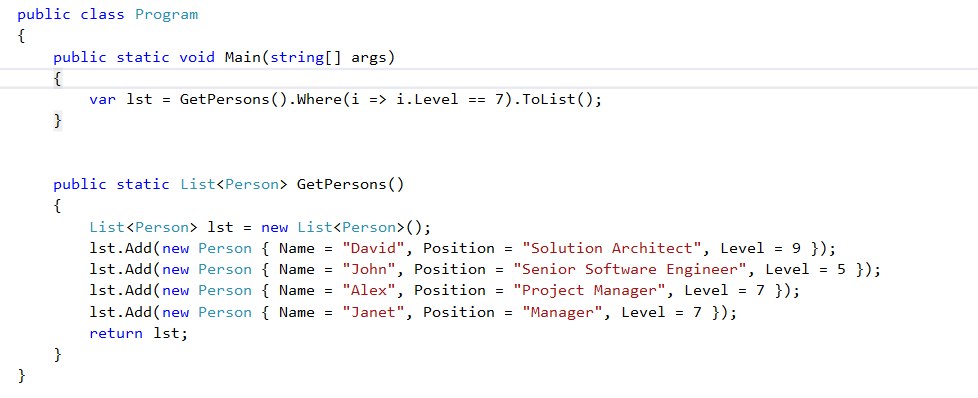
Let’s see a quick example. Below is the sample method GetPersons that returns the list of 4 persons.
In order to debug list we can put a break point as shown below
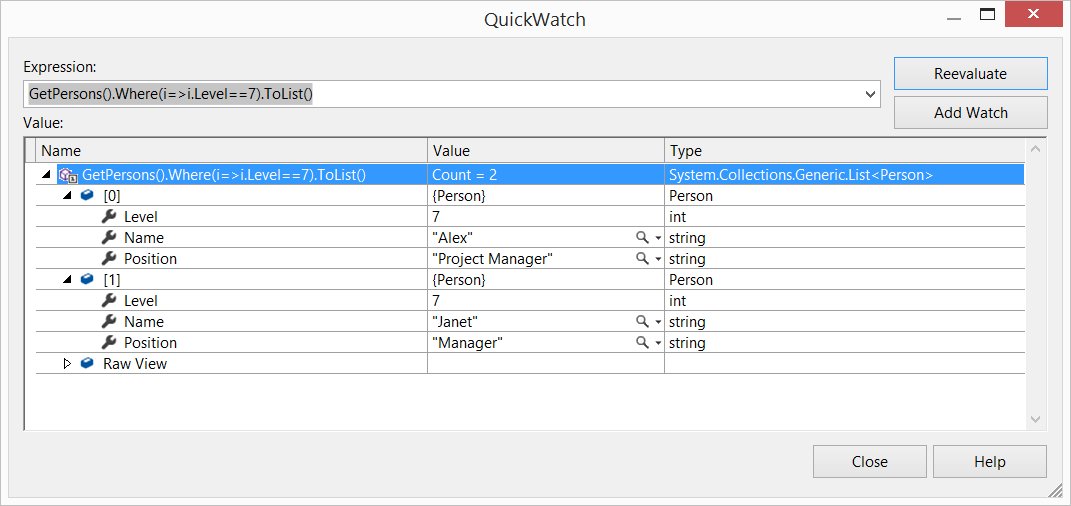
Below snapshot showing Lambda expression to filter list in Watch window
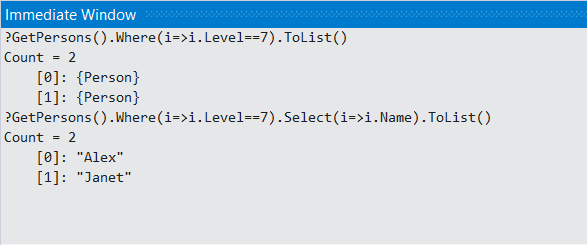
Lambda expression to filter list in Immediate Window
And LINQ expression to filter list in Immediate Window
PerfTips
PerfTips provide the performance information when debugging code. It is very essential if you want to analyze the code performance and optimize it where required. PerfTips can be shown in two conditions. First you have to set the initial break point from where you need to check the performance and then either Step Over or put another break point to check the complete time taken for the particular block of code.
Below snapshot showing the PerfTips of less than 3 millisecond of time taken to execute GetPersons method
We can also provide a break point at starting and at the end of the method to check the complete time taken as shown below
You can also click on the elapsed timeline link to see the detailed information in Diagnostic Tools Window.
Hope this helps!


