Troubleshooting MOSS/WSS Performance Issues
One of the things that I find myself doing more and more of is troubleshooting performance related issues for SharePoint. We’re at the point in the lifecycle of the product where people have it installed, it’s working (for the most part) and they want it to crawl/search/render faster.
Performance issues, by their very nature, are not (typically) resolved quickly. The process usually involves the gathering of large amounts of disparate data, correlating it, and looking for patterns and anomalies. Strangely, one of our biggest challenges in support is collecting the data in a consistent manner for analysis.
Over the last year, or so, I’ve come up with a set of instructions that I feel will help streamline not only the collection of the data for analysis by Microsoft but should also serve as a best practice for customers who wish to monitor and tune their own performance. I’ve broken this out as follows:
- Web Front Ends/Query Servers
- Index Server(s)
- SQL Server(s)
- IIS Log Data
- ULS Log Data
- Event Log Data
- Naming conventions to use
Web Front Ends/Query Servers
Frequency: Daily
Detail:
1. Please ensure that the instructions in https://support.microsoft.com/kb/281884 are followed. This will allow for the Process ID value to be included as part of the process monitor data that is being captured.
2. The following counters need to be collected on all web front end and query servers on a daily basis:
- Web Front End/Query Servers (WFECounterList_MOSS2007.txt)
- \ASP.NET(*)\*
- \ASP.NET v2.0.50727\*
- \ASP.NET Apps v2.0.50727(*)\*
- \.NET CLR Networking(*)\*
- \.NET CLR Memory(*)\*
- \.NET CLR Exception(*)\*
- \.NET CLR Loading(*)\*
- \.NET Data Provider for SqlServer(*)\*
- \Processor(*)\*
- \Process(*)\*
- \LogicalDisk(*)\*
- \Memory\*
- \Network Interface(*)\*
- \PhysicalDisk(*)\*
- \SharePoint Publishing Cache(*)\*
- \System\*
- \TCPv4\*
- \TCPv6\*
- \Web Service(*)\*
- \Web Service Cache\*
Index Servers (IDXCounterList_MOSS2007.txt)
-
- \ASP.NET(*)\*
- \ASP.NET v2.0.50727\*
- \ASP.NET Apps v2.0.50727(*)\*
- \.NET CLR Networking(*)\*
- \.NET CLR Memory(*)\*
- \.NET CLR Exception(*)\*
- \.NET CLR Loading(*)\*
- \.NET Data Provider for SqlServer(*)\*
- \Processor(*)\*
- \Process(*)\*
- \LogicalDisk(*)\*
- \Memory\*
- \Network Interface(*)\*
- \Office Server Search Archival Plugin(*)\*
- \Office Server Search Gatherer\*
- \Office Server Search Gatherer Project(*)\*
- \Office Server Search Indexer Catalogs(*)\*
- \Office Server Search Schema Plugin(*)\*
- \PhysicalDisk(*)\*
- \SharePoint Publishing Cache(*)\*
- \Web Service(*)\*
- \Web Service Cache\*
- \SharePoint Search Archival Plugin(*)\*
- \SharePoint Search Gatherer\*
- \SharePoint Search Gatherer Project(*)\*
- \SharePoint Search Indexer Catalogs(*)\*
- \SharePoint Search Schema Plugin(*)\*
- \System\*
- \TCPv4\*
- \TCPv6\*
- SQL Servers (SQLCounterList_MOSS2007.txt)
- \.NET Data Provider for SqlServer(*)\*
- \Processor(*)\*
- \Process(*)\*
- \LogicalDisk(*)\*
- \Memory\*
- \PhysicalDisk(*)\*
- \Network Interface(*)\*
- \NBT Connection(*)\*
- \Server Work Queues(*)\*
- \Server\*
- \SQLServer:Access Methods\*
- \SQLServer:Catalog Metadata(*)\*
- \SQLServer:Exec Statistics(*)\*
- \SQLServer:Wait Statistics(*)\*
- \SQLServer:Broker Activation(*)\*
- \SQLServer:Broker/DBM Transport\*
- \SQLServer:Broker Statistics\*
- \SQLServer:Transactions\*
- \SQLAgent:JobSteps(*)\*
- \SQLServer:Memory Manager\*
- \SQLServer:Cursor Manager By Type(*)\*
- \SQLServer:Plan Cache(*)\*
- \SQLServer:SQL Statistics\*
- \SQLServer:SQL Errors(*)\*
- \SQLServer:Databases(*)\*
- \SQLServer:Locks(*)\*
- \SQLServer:General Statistics\*
- \SQLServer:Latches\*
- \System\*
- \TCPv4\*
- \TCPv6\*
3. Next, you will want to create text file that contains your counters. I suggest the following:
- Web Front Ends Server(s)/Query Server - WFECounterList_MOSS2007.txt
- Index Server(s) – IDXCounterList_MOSS2007.txt
- SQL Server(s) – SQLCounterList_MOSS2007.txt
4. From a command line, issue the following command on every web front end in your farm. You will need to change the drive letters & locations, as well as the counter list being used, so that they are appropriate for your environment. Please use an account that has administrative access to the server in order to ensure that we have access to the appropriate counters. Substitute the domain\userid in the appropriate section of the command below. Also, you will be prompted for the password; so, do not enter it on the command line.
The command should resemble the following:
Baseline counter |
logman create counter Baseline -s %COMPUTERNAME% -o C:\PerfLogs\Baseline_%COMPUTERNAME%.blg -f bin -v mmddhhmm -cf [WFE|IDX|SQL]CounterList_MOSS2007.txt -si 00:01:00 -cnf 12:00:00 -b mm/dd/yyyy hh:mm AM -u "domain\userid" * |
Incident counter |
logman create counter Incident -s %COMPUTERNAME% -o C:\PerfLogs\Incident_%COMPUTERNAME%.blg -f bin -v mmddhhmm –cf [WFE|IDX|SQL]CounterList_MOSS2007.txt -si 00:00:05 -max 500 -u "domain\userid" * |
5. We have defined two (2) sets of counters to be used: Baseline & Incident. The baseline counter should be running 24x7 in the environment. This will allow us to capture baseline performance data so that we have something against which to evaluate any changes. For the purposes of illustration, here is the command to begin collecting data on 08/18/2009 @ 6:00 am in the morning. We will capture 12-hours of data, and then rotate the logs.
logman create counter Baseline -s %COMPUTERNAME% -o C:\PerfLogs\Baseline_%COMPUTERNAME%.blg -f bin -v mmddhhmm -cf WFECounterList_MOSS2007.txt -si 00:01:00 -cnf 12:00:00 -b 8/18/2009 6:00 AM -u "domain\userid" *
When an incident occurs, we will need to capture more fine-grained data. For that purpose, we have defined an Incident-based counter to be used. This is identical to the baseline counter except that it samples more frequently. Due to the increased sample rate, it will collect more data faster than the baseline counter. You need to be diligent with respect to maintaining sufficient disk space to accommodate incident-based captures. This counter set should only be used during an incident/outage and only for the minimal time necessary. Once the incident-based data has been collected, you may turn off the incident counters. However, the baseline counters should continue to be run 24x7 until further notice.
In our example above, the sample rate for the Incident counter has been set to every 5 seconds. This is by no means an absolute value and may need to be adjusted depending upon the particular type of performance problem that you are troubleshooting.
To start the incident based counter, issue the following command from a command line prompt:
logman start Incident -s %COMPUTERNAME% .
If you are starting the counter local to the machine in question, %COMPUTERNAME% will expand to the appropriate value; otherwise, you will need to specify the NetBIOS name of the computer.
6. Assuming a data upload time of 6:00pm (or later), you may have up to three (3) files containing performance data:
- Baseline_%COMPUTERNAME%_mmddhhmm_001.blg (Yesterday: 6p-6a)
- Baseline_%COMPUTERNAME%_mmddhhmm_002.blg (Today: 6a-6p)
- Baseline_%COMPUTERNAME%_mmddhhmm_003.blg (Today[new]: 6p-6a)
IIS Log Data Collection
Frequency: Daily
Detail:
On each of the web front ends/query servers, we will want to capture IIS traffic so that we can do a thorough traffic analysis. Our intent is to correlate the IIS traffic with what we’re seeing in the performance data.
Windows 2003
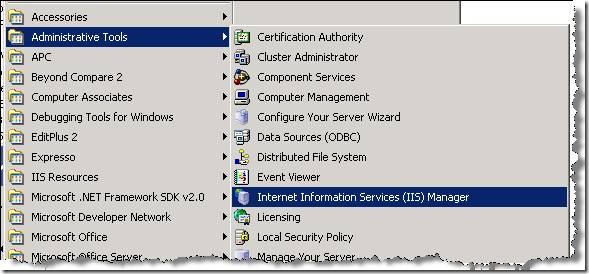
1. Start the Internet Information Services (IIS) Manager on each machine. The easiest way to accomplish this via the applet in the a Administrative Tools section of the Start menu
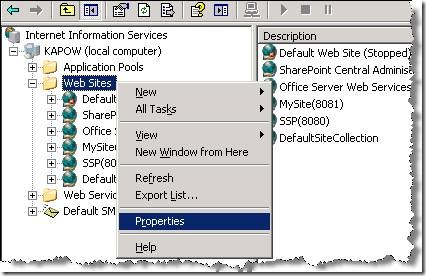
2. Open the tree up (on the left hand side) until Web SItes is available. Select and right-click to bring up the Properties pane. This should apply the settings for all of the web sites defined underneath
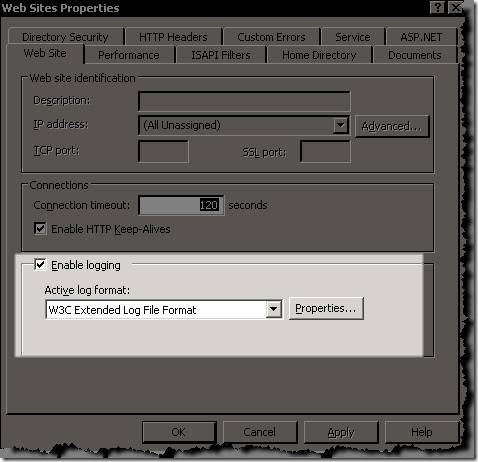
3. Verify that Logging is enabled as well as the w3c Extended Log File Format is specified
4. Click on the Properties... button to get to the detail
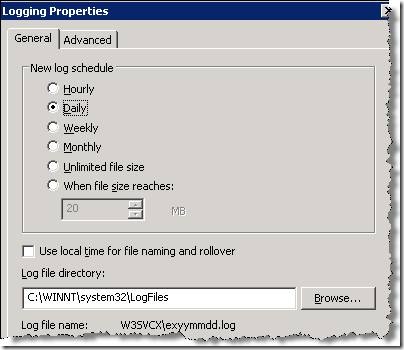
5. Click on the Advanced tab and make sure that ALL properties are selected. If you would like to see what each of these fields means, check out the following: W3C Extended Log File Format (IIS 6.0)
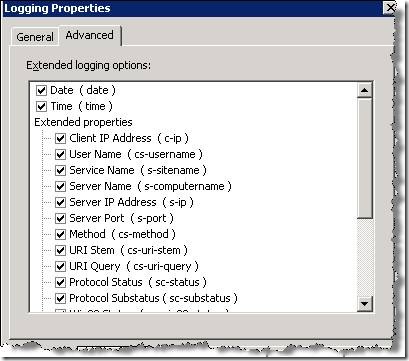
6. Once all have been selected, Apply and exit out of the IIS Configuration.
7. At this point, perform an IISReset on each machine. This will force the new log settings to be picked up. I would suggest you visually verify (examine the newest logfile) to make sure that all fields are now being tracked.
Windows 2008
1. Start the Internet Information Services (IIS) manager on each machine. The easiest way to accomplish this is via the applet in the Administrative Tools section of the Start menu

2. Click on the Machine node in the tree (left hand side). This will bring up the area view in the right hand side. Your display should similar to the following:

3. You will want to double click on the Logging icon to in the IIS section (see diagram above). This will open up the logging options screen

4. Click on the Select Fields button for the format. Make sure that the Format is set to the default value of W3C. Select all fields to be logged and then click on the OK button at the bottom of the dialog box

5. Exit out of the IIS Manager at this point
6. I would recommend an IISReset on each machine where this change was made. This will force the new log settings to be picked up. I would suggest you visually verify (examine the newest logfile) to make sure that all fields are now being tracked.
ULS Log Data Collection
Frequency: Daily
Detail:
1. From central administration server (TDCUKMWS01), the following series of commands will need to be executed from a DOS command prompt window. It is assumed that MOSS/WSS has been installed in the default location.
- cd /d %commonprogramfiles%\microsoft shared\web server extensions\12\bin
- stsadm -o setlogginglevel -default
2. You should see the following messages appear in the command prompt window
- Updating DiagnosticsService
- Updating SPDiagnosticsService
- Operation completed successfully
3. You will need to verify that the Tracing Service is active and collecting valid data. From the ULS Log folder, scan the directory and ensure the newest 5 files are >10 kilobytes. If they are less, open the newest file and ensure that the only message(s) are not, “Tracing Service list trace events. Current value –n.” If this message appears, restart the tracing service by launching a command prompt on the server and typing ‘net stop sptrace’, ensuring the following messages appear:
- The Windows SharePoint Services Tracing service is stopping.
- The Windows SharePoint Services Tracing service was stopped successfully.
Once the service is successfully stopped, at the prompt, type ‘net start sptrace’, ensuring the following messages appear:
- The Windows SharePoint Services Tracing service is starting.
- The Windows SharePoint Services Tracing service was started successfully.
4. Review the newest ULS log, ensuring tracing events are successfully written to the log.
Event Log Data Collection
Frequency: Daily
Detail:
1. On a daily basis, we will need the application & system event logs for the past 24 hours. The simplest way to accomplish this is to use the eventquery.vbs applet that is part of the Operating System on Windows 2003. It is located in %windir%\system32\eventquery.vbs
2. Assuming that the date in question is 04/20/2009, the following command will produce the output that is desired:
- %windir%/system32/cscript.exe /nologo %windir%\system32\eventquery.vbs /L Application /V /FI "Datetime eq 04/20/09,12:00:00AM-04/20/09,11:59:59PM" /FO CSV > 042009_Application_%COMPUTERNAME%.csv
- %windir%/system32/cscript.exe /nologo %windir%\system32\eventquery.vbs /L System /V /FI "Datetime eq 04/20/09,12:00:00AM-04/20/09,11:59:59PM" /FO CSV > 042009_System_%COMPUTERNAME%.csv
If the eventquery.vbs is not an option for you, the same thing can be accomplished via the UI as follows:
1) Open the Event View applet and select the appropriate log from the list on the left hand side. In the example show, we will be selecting the Application log; however, the steps are generic enough that they can be applied to any event log.
2) From the menu across the top, select the Filter option
![clip_image002[5] clip_image002[5]](https://msdntnarchive.z22.web.core.windows.net/media/TNBlogsFS/BlogFileStorage/blogs_msdn/mmcintyr/WindowsLiveWriter/TroubleshootingMOSSWSSPerformanceIssues_CA3F/clip_image002%5B5%5D_thumb.jpg)
3) We will be selecting the Events On for both the From: and To: portion of the filter. Please modify the dates and time to include the previous 24-hour time period. For example, if today is 04/23/2009, we would see the values as seen below. This will result in all data from the previous day being captured
![clip_image004[5] clip_image004[5]](https://msdntnarchive.z22.web.core.windows.net/media/TNBlogsFS/BlogFileStorage/blogs_msdn/mmcintyr/WindowsLiveWriter/TroubleshootingMOSSWSSPerformanceIssues_CA3F/clip_image004%5B5%5D_thumb.jpg)
4) Once the filter criteria has been established, click on the OK button. This will return us to the Event Viewer application. From here, make certain that the Application Log is selected. Right-click and select the Export List... option
![clip_image006[5] clip_image006[5]](https://msdntnarchive.z22.web.core.windows.net/media/TNBlogsFS/BlogFileStorage/blogs_msdn/mmcintyr/WindowsLiveWriter/TroubleshootingMOSSWSSPerformanceIssues_CA3F/clip_image006%5B5%5D_thumb.jpg)
5) Export the file in a CSV format using the naming convention: ApplicationLog_%COMPUTERNAME%_MMDDYY.csv
![clip_image008[6] clip_image008[6]](https://msdntnarchive.z22.web.core.windows.net/media/TNBlogsFS/BlogFileStorage/blogs_msdn/mmcintyr/WindowsLiveWriter/TroubleshootingMOSSWSSPerformanceIssues_CA3F/clip_image008%5B6%5D_thumb.jpg)
Naming Conventions to Use
This data should be compressed (either winrar or winzip) and conform to the following naming standards:
- IIS Logs: IIS_%COMPUTERNAME%_MMDDYY.[ZIP|CAB|RAR]
- Application logs: EventLogs_%COMPUTERNAME%_MMDDYY.[ZIP|CAB|RAR]
- ULS Logs: ULSLogs_%COMPUTERNAME%_MMDDYY. [ZIP|CAB|RAR]
- Performance Logs: Perf_%COMPUTERNAME%_MMDDYY.[ZIP|CAB|RAR]
- Misc Logs: Misc_%COMPUTERNAME%_MMDDYY.[ZIP|CAB|RAR]
DO NOT attempt to compress the files on the same machine that is responsible for gathering the data. This places an undue burden on the machine and only serves to skew the performance data that is being gathered. We suggest that you perform your compressions & uploads from a machine that is not being actively monitored.
Summary
Is this the only way to collect this data? Absolutely not! What I have tried to do here is bring some consistency and uniformity of process to our problem domain. As I said, troubleshooting performance issues is arduous work. Wherever you can simplify tasks, go for it. Hopefully, this will simplify the data collection portion. The fun part is still left to you!
Enjoy!