DFSR Debug Analysis with Message Analyzer – Part 3, DFSR Debug Log Analysis Grid Layout
This post continues the series that started here.
Last post concluded showing fields that had been parsed from DFSR debug log single-line messages. Here’s the screenshot again –
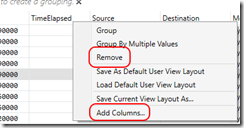
This is good but I’d really like to see interesting fields displayed in the columns and irrelevant fields removed.
It’s as simple as right-clicking the column headers –
I can also drag columns to the location I want them to arrive at the view I’d like –
Now I can save the Analysis Grid Layout using Session –> Analysis Grid –> Layout –> Save Current Layout As …
I choose the Name and Category and I’m done –
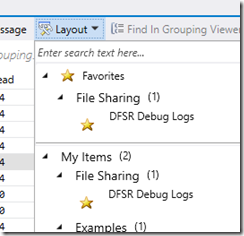
The Layout is saved and available from the Layout menu in future –
Next Up


