Permutation Feature Importance
This blog post is authored by Said Bleik, Data Scientist at Microsoft.
We are pleased to announce the addition of a new feature importance module to Azure ML Studio, namely Permutation Feature Importance (PFI).Inspired by the randomization technique used in random forests, we developed a model-agnostic feature ranker that is compatible with both classification and regression models. This post briefly describes the concept behind the algorithm and shows how the module can be used in a sample experiment.
What Is It
PFI is an algorithm that computes importance scores for each of the feature variables of a dataset. The importance measures are determined by computing the sensitivity of a model to random permutations of feature values. In other words, an importance score quantifies the contribution of a certain feature to the predictive performance of a model in terms of how much a chosen evaluation metric deviates after permuting the values of that feature.
The intuition behind permutation importance is that if a feature is not useful for predicting an outcome, then altering or permuting its values will not result in a significant reduction in a model’s performance. This technique is commonly used in random forests and is described by Breiman in his seminal paper Random Forests. The approach, however, can be generalized and adapted to other classification and regression models.
Given a trained model, a test dataset, and an evaluation metric, the Permutation Feature Importance module creates a random permutation of a feature column (shuffles the values of that column) and evaluates the performance of the input model on the modified dataset. This is done iteratively for each of the feature columns, one at a time. The module then returns a list of the feature variables and their corresponding importance scores. The importance score is defined as the reduction in performance after shuffling the feature values. When the evaluation metrics used measure how accurate the predictions are (that is when larger values are better, such as Accuracy, Precision, Coefficient of Determination, etc...) the PFI score is simply defined as pfi = Pb-Ps, where Pb is the base performance metric score and Ps is the performance metric score after shuffling. If, however, the evaluation metric used is an error/loss metric (such as Root Mean Square Error, Log Loss, etc…), then the score is defined as: pfi = -(Pb-Ps). Thus no matter which metric is chosen within the module, a higher value implies the feature is more important.
Sample Experiment
To illustrate how this works, we will create a simple Azure ML experiment using the Automobile price data dataset available in Azure ML Studio. The dataset contains details of car instances, including car features (dimensions, engine specs, make, etc.) and price. Consider the task of predicting the price of a car given all other features using a linear regression model.
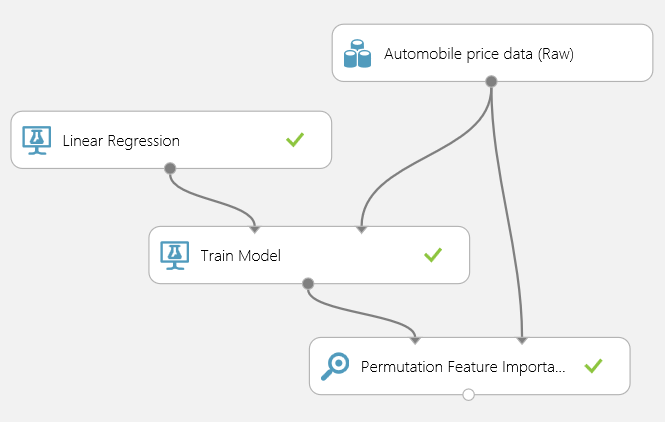
For this experiment we would need to train a linear regression model (using price as the target variable) and input the trained model together with the dataset to a Permutation Feature Importance module as shown below.

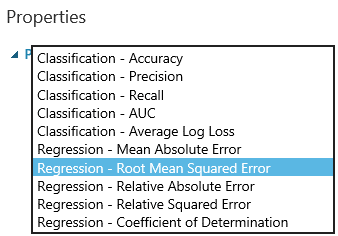
We also need to select an appropriate evaluation metric that the module would use to evaluate the regression model (that is the Metric for measuring performance property). We choose the root mean squared error in this case.

After running the experiment, we can visualize the results by clicking on the output port of the Permutation Feature Importance module. The results table shows a list of the features ordered by the importance score.

The results can be interesting and unexpected in some cases. The feature ranking results of PFI are often different from the ones you would get when using common feature selection statistics (such as Pearson Correlation and Chi Squared) that are applied before a model is fit. This is due to the fact that PFI doesn’t attempt to capture an explicit measure of association between a feature and the target variable as other methods do, but rather how much the feature influences predictions from the model. Different feature importance scores and the rank ordering of the features can thus be different between different models. This is useful in many cases, especially when training non-linear and so-called “black-box” models where it is difficult to explain how the model characterizes the relationship between the features and the target variable.
Do try it out yourself using different models and metrics and let us know what you think. Also, stay tuned for future versions of the module, we plan to add new capabilities such as the ability to use importance scores to filter the number of features in the model.
Said
Subscribe to the Machine Learning blog