Project Siena - Hello World
I wanted to write about Microsoft Project Siena, currently in its Beta. Project Siena is a fantastic tool to rapidly create professional apps with programming limited to excel like functions. To test drive the features, let’s create an app that displays the daily news, weather, traffic etc. We will keep the UI light weight with labels, buttons and images and focus on powering the app with data from (REST) services.
Pre-requisites
Download the app from the Windows Store here: https://aka.ms/GetProjectSiena. You will also need the WADL Generator tool. The installations are fairly straight forward. I will talk about the concepts and flow more in my future posts, for now let’s dive right into the example.
Let’s split the app into adding the following:
- News ticker
- Weather data
- Clock
- Stock chart
Adding a news ticker
Let’s first create a ticker and then wire the ticker to a news feed.
Create a ticker
To create a ticker, add a label with some text. Adjust the Y position to near bottom of the screen. The X position of the label needs to be progressively increased/decreased at different points in time to give the marquee effect. To get the desired effect, tie the X location value to a timer as shown in the functions below.
PlayPause Timer |
Comments |
 |
Initialize with approx. length of a character and scroll speed |
 |
How long to scroll before resetting the timer |
Ticker label |
Comments |
 |
label moves from right to left as the timer value increases |
Querying REST service
Replace the ticker text with content from a news service. In this example, I use the NYTimes developer API to update the ticker.
Note: you would first need to register for API key from https://developer.nytimes.com/.
To integrate with Project Siena, we need the WADL describing the REST API from NYTimes. Instead of hand coding the WADL, I am going to use the WADL generator tool mentioned earlier. The following screen calls out the API and its parameters.
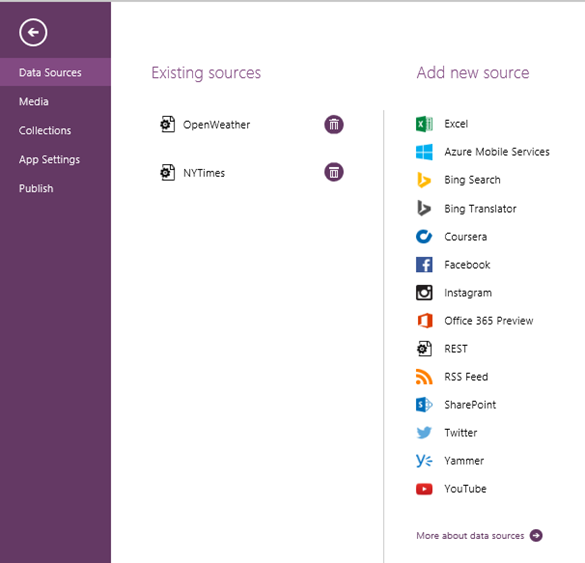
Now we can go to AppData-> Data Sources and add the WADL file.
Once added, the API is available for use in Project Siena functions. Change the ticker label text with the result of the API call:
Ticker label |
Comments |
 |
Get label text from NYTimes news |
For configuration purpose, I have added a NewsCategory combo-box to choose the news section.
NewsCategory |
Comments |
 |
NYTimes news sections. You can get more strings from the developer docs |
If things have been configured correctly, the news ticker should look similar to this:
Adding weather data
Similar to News, you can query popular weather APIs to retrieve city specific weather information. In this example, I use the OpenWeatherMap API for querying current and forecast weather data.
For API key, usage, pricing, Terms of Use and other guidelines, refer to https://openweathermap.org
Once again use the WADL Generator tool to add two functions querying OpenWeatherMap – one to get weather by city and another one to get the forecast for the next 4 days.
If you look at the json output, notice OpenWeatherMap output publishes a reference to the weather icon. We can tie this URL to the image control in Project Siena. I have added an option for users to select the city.
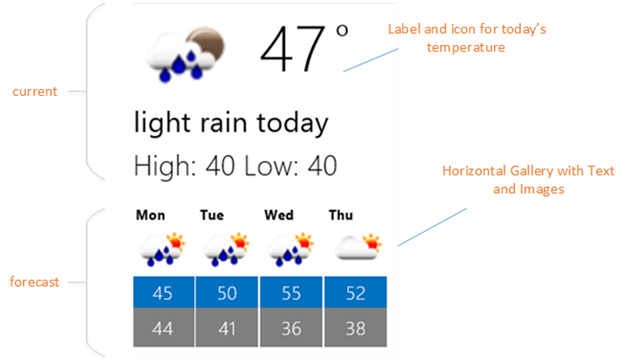
After arranging the control and updating colors, the weather forecast should look similar to this:
Note: the JSON response for the weather forecast returns date time in UNIX UTC format. To convert it to days of week as shown above, a quick hack would be to define the time elapsed until some recent day and add it back to the date value and format it using Text function:
Function |
Comment |
 |
Quick hack to convert UNIX UTC to day of week |
Adding clock and stock chart
It’s easy to add a quick stock chart as an image by querying another REST API and also add a simple clock using another timer “Timer2”.
Function |
Comment |
 |
Current Date |
 |
Current Time |
 |
Finance bar chart with fixed stock symbol. For options to configure refer to the link below. |
Wrapping it up…
Adding the controls to Project Siena is the fun part of the whole process! The app on completion should look something similar to the one below.
You can now publish the app and install to your Windows devices.
You can extend this simple app by add a Settings page to configure Celsius/Farenheit, stock symbol name, news source, locale etc.
If there are ways to improve this app or areas you would like to hear more, please leave your comments below!
References
Project Siena tutorials/samples: https://www.microsoft.com/en-us/projectsiena/default.aspx
NYTimes developer API: https://developer.nytimes.com/
OpenWeatherMap API: https://openweathermap.org/api
REST APIs for stock chart from Yahoo Finance: https://bit.ly/1Cm1o5S
-Karthik


