SQL 2005 (SQL 2008) Analysis Services Server Side Tracing
With Analysis Services 2005 (2008) you can collect traces without using gui this feature is known as Server Side Tracing.
In this article we’ll talk about how to achieve Server Side Tracing.
How to create a Server Side Trace
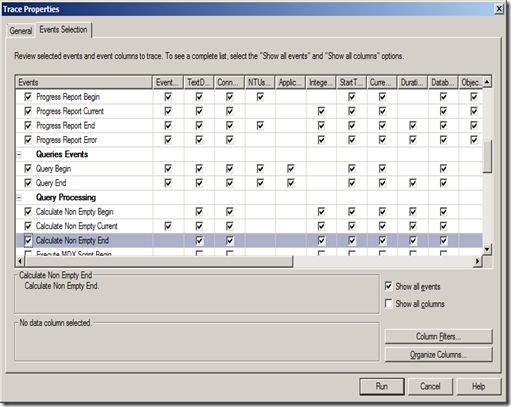
- Open SQL Server profiler connect to Analysis Services and in an Event Selection define the SSAS Events.
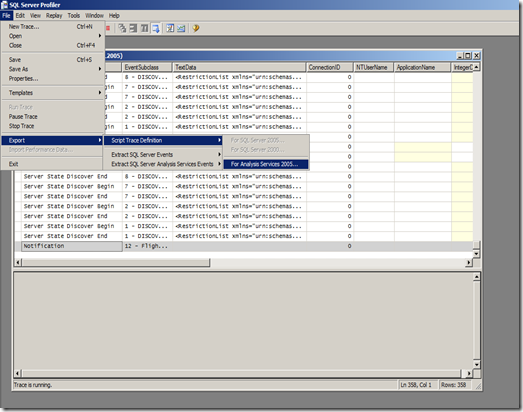
- Next script the trace by going to "File – Export – Script Trace Definition – For Analysis Services 2005 (AS 2005 and 2008 in case of 2008)".
- Open the Script file in Notepad and cut and copy the Events and Filter Elements to below mentioned script.
<!--Copy this Script file in Notepad and Replace Events and Filters Elements with the elements which you had generated from Trace Definition file—>
<Batch xmlns="https://schemas.microsoft.com/analysisservices/2003/engine" xmlns:soap="https://schemas.xmlsoap.org/soap/envelope/"> <Create xmlns="https://schemas.microsoft.com/analysisservices/2003/engine"> <ObjectDefinition> <Trace> <ID>DBA Performance Trace</ID> <Name>DBA Performance Trace</Name> <!--UPDATE YOUR OUTPUT PATH!!!!!!!--> <LogFileName>C:\OLAP_TRACE.trc</LogFileName> <LogFileAppend>1</LogFileAppend> <AutoRestart>0</AutoRestart> <!--Logfilesize is in MB--> <LogFileSize>5000</LogFileSize> <LogFileRollover>1</LogFileRollover> <!-- Uncomment and upade stoptime if you want to auto stop --> <!--StopTime>...</StopTime—> <Events> <!--Add Events from the Trace Definition File—> </Events> <Filter> <!--Add If you have defined any filters then add it here—> </Filter> </Trace> </ObjectDefinition> </Create> </Batch>
After Making Changes Script Will Look Something Like this. <Batch xmlns="https://schemas.microsoft.com/analysisservices/2003/engine" xmlns:soap="https://schemas.xmlsoap.org/soap/envelope/"> <Create xmlns="https://schemas.microsoft.com/analysisservices/2003/engine"> <ObjectDefinition> <Trace> <ID>DBA Performance Trace</ID> <Name>DBA Performance Trace</Name> <!--UPDATE YOUR OUTPUT PATH!!!!!!!--> <LogFileName>C:\OLAP.trc</LogFileName> <LogFileAppend>1</LogFileAppend> <AutoRestart>0</AutoRestart> <!--Logfilesize is in MB--> <LogFileSize>5000</LogFileSize> <LogFileRollover>1</LogFileRollover> <!-- Uncomment and upade stoptime if you want to auto stop --> <!--StopTime>...</StopTime--> <Events> <Event> <EventID>15</EventID> <Columns> <ColumnID>28</ColumnID> <ColumnID>32</ColumnID> <ColumnID>36</ColumnID> </Columns> </Event> <Event> <EventID>16</EventID> <Columns> <ColumnID>24</ColumnID> <ColumnID>32</ColumnID> <ColumnID>1</ColumnID> </Columns> </Event> </Events> <Filter> <NotLike> <ColumnID>37</ColumnID> <Value>SQL Server Profiler</Value> </NotLike> </Filter> </Trace> </ObjectDefinition> </Create> </Batch>
Open Management Studio on Server or any Client box connect to Analysis Services then go to file –> New XMLA Command –> Copy this Script and Execute it, this will initiate Trace on Server.
How to Find out whether Script is Running
| <!--This script will give you a list off all running traces—> <!—By Default you will get trace for Flight Recorder—> <Discover xmlns="urn:schemas-microsoft-com:xml-analysis"> <RequestType>DISCOVER_TRACES</RequestType> <Restrictions> <RestrictionList> </RestrictionList> </Restrictions> <Properties> <PropertyList> </PropertyList> </Properties> </Discover> |
How to Drop the Trace which you had created
<Delete xmlns="https://schemas.microsoft.com/analysisservices/2003/engine" xmlns:soap="https://schemas.xmlsoap.org/soap/envelope/"> <Object> <TraceID>DBA Performance Trace</TraceID> </Object> </Delete> |
Note:
When you generate a trace definition using Profiler Trace it excludes LogFileName, LogSize etc, that is why I had suggested to use script which I had created.
Secondly, you need to define the stop time or you can drop the trace by giving above mentioned command (this will only stop the trace but will not physically drop the file).
This trace script file is amended from an example given in SSAS Processing Best Practices
Comments
Anonymous
November 08, 2009
Excellent tip! Using ascmd.exe to schedule start time makes an easy way to schedule a trace for start/stop, e.g., for when there is a known crash that will occur in early morning hours during processing event, etc.Anonymous
November 10, 2009
thanks JonAnonymous
February 02, 2010
In SQL Server Trace there is an option to directly save to database table to but when I export a trace definition using Profiler Trace it does not show the elements for database (just as it does not for log file - if the file option was chosen).. Could you please help what are the elements if database option is chosen instead of log file.Anonymous
February 02, 2010
You can use SQL Profiler to store trace data into files or tables. If you configure SQL Profiler to store trace information into a SQL Server table, you will notice that the EventClass and EventSubClass descriptions are converted to numeric values instead of textual descriptions. This is because numeric values are language neutral, whereas SQL Server Profiler performs translations into the default locale of the current user. The textual translations for the English are stored in "[Drive]:Program FilesMicrosoft SQL ServerMSSQL.XOLAPbinResources1033tracedefinitionXX.xml" where Xs corresponds to the installed version of SQL Server. Refer this: http://blogs.msdn.com/danhardan/archive/2008/09/10/sql-profiler-eventclass-eventsubclass-column-descriptions.aspxAnonymous
February 02, 2010
Thanks karan for the prompt reply. Many thanks for the side-info regarding EventClass and the EventSubClass too however I was looking for a solution similar to the one you presented above - where instead of <LOGFILE...> i could have used <TRACETABLE...> or similar element-tags. Is the SQL Server Profiler only solution if I wanted to store the result to database?Anonymous
February 02, 2010
Hi Karan, In response to my previous query is http://msdn.microsoft.com/en-us/library/bb283156.aspx the only solution? TIAAnonymous
February 02, 2010
Yes sir :)Anonymous
February 02, 2010
Thanks once again Karan, on a side note, are there any similar solutions for the MS-SQL RDBMS tracing?Anonymous
February 03, 2010
well, i had never tried with SQL RDBMS but below mentioned links will give you some directions. http://msdn.microsoft.com/en-us/library/ms191006.aspx http://msdn.microsoft.com/en-us/library/ms191443.aspxAnonymous
February 03, 2010
Thanks for the links, I have looked at these options before and yes they are good for log-file output but i was looking for the trace to be stored in the database itself just as the ASTrace utility. The ASTrace utility works like a charm for SSAS trace logging in database.Anonymous
February 03, 2010
I used the same code of the ASTrace and modified so that it can trace the RDBMS too (just changed the olapconnection to sqlconnection) - seems it is working.Anonymous
February 03, 2010
Thanks for sharing that. I am happy that this blog helped you in achieving what you are looking for. Regards Karan GulatiAnonymous
March 18, 2011
Here are this and some other articles on Profiler, SSAS Server Trace and Performance Counters: ssas-wiki.com/.../ArticlesAnonymous
December 13, 2011
Great tip!! For additional SQL Server performance and tracing tips, check out the new SQL Server Performance Guide, on the TechNet Wiki. Through this wiki the doc team is trying to put performance-related information in one place. social.technet.microsoft.com/.../sql-server-performance-survival-guide.aspxAnonymous
July 12, 2012
How to create Server Side Trace for Analysis Service Which stores data into Sql Service Table. I was tring withASTrace utility but failed to find out how to use that utility. Can any body help me? Thanks in Advance.Anonymous
July 12, 2012
Hello Chandan - sorry to hear that you were not able to use ASTrace Utility. For new release i had provided step by step of using it in Documentation. Here is the link - fee free to use it and contact me if you need any kind of clarifications. Go to this link - sqlsrvanalysissrvcs.codeplex.com You will find AS Trace2008 and AS Trace2012 Click on it and it will allow you to download updated binaries with step by step configuration details. feel free to ping me if you need any help. Karan GulatiAnonymous
September 06, 2012
Thank you for sharing. You create the trace for the whole Server, right ? A question, if there are many databases in the Analysis Server, how can I create the trace for the database chosen?Anonymous
September 10, 2012
yes you can do that, while create a trace template like shown in a post, there is a way of selecting a specific database - go to column filter (option shown in first image) and then add filters as per your requirement.Anonymous
September 11, 2012
I got that, thank you very much!

