It takes 4 Clicks to Build a Model (Cube) in Denali Tabular Mode
Click 1 – Create a Tabular Project
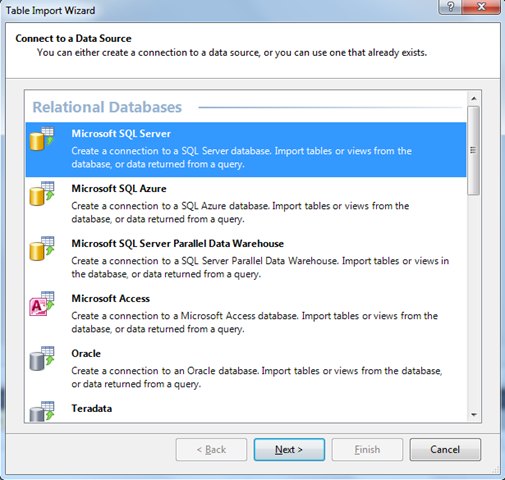
Click 2 – Import Tables (Master / Facts) from DW
Click 3 – Adding Measure
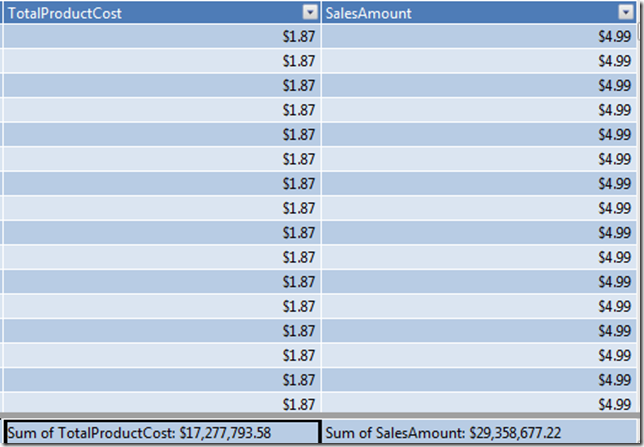
As you can see I have added 2 Measures -
Sum (TotalProductCost)
Sum of TotalProductCost:=SUM([TotalProductCost])
Sum of SalesAmount:=SUM([SalesAmount])
Click 4 – Viewing Cube in Excel
Click on Excel Symbol on Tool Bar, this will open Cube in Pivot Table
(Ensure that Excel is installed in your workstation)
In PivotTable – Selected Color (Product – Color) Attribute and two Measures which we had created


