Using PowerShell and Excel PivotTables to understand the files on your disk
Introduction
I am a big fan of two specific technologies that usually don’t get mentioned together: PowerShell and Excel PivotTables. It started when I was explaining PivotTables to someone and the main issue I had was finding a good set of example data that is familiar to everyone. That’s when it hit me. People using a computer have tons of files stored in their local disks and most don’t have a clue about those files. That’s the perfect example!
So I set out to gather the steps to gather information about your local files and extract the most information about it.
Step 1 – List the questions you need to answer
To start, here are a few questions you might have about the files in your local hard drive:
- Which folder is storing the most files or using up the most space in your local disk?
- What kind of data (pictures, music, video) is using the most space in your local disk?
- What is the average size of the pictures you took this year?
- How much of the files in your local disk was created in the last 30 days? Or this year?
- Which day of the week do you create the most new pictures? Or PowerPoint presentations?
Now you could write a PowerShell script to answer any of those questions. It would in itself be a great programming exercise, but some would be quite tricky to code. However, those questions are just the tip of the iceberg. Given that dataset, you could come up with many, many more. So the point is that you would use Excel PivotTables to explore the data set and come up with the answers while interacting with it.
Step 2 – Gather the required raw data
In any work with PivotTables and BI (Business Inteligence) in general, you need to identify the raw data that you can use to produce the answers to your questions. As you problably already figured out, we’ll use PowerShell to query the file system and extract that data. Using the Get-ChildItem (more commonly known by its alias: DIR), you can get information about each folder and file on the disk.
Now with possibly hundreds of thousands of files, you want to make sure you gather only the necessary data. That will make it faster to obtain and will give Excel less data to chew on, which is always a good thing.Here’s what you could use (running as an administrator), to get information:
Dir C:\ -Recurse | Select FullName, Extension, Length, CreationTime, Attributes
Next, you want to make sure you transform into into a format that Excel can consume. Luckly, PowerShell has a cmdlet to transform data into Comma-Separated Values, also known as CSV. You need to also include something to avoid any permission errors while accessing the data and output the results to a file, so we can load it into Excel. Here’s the final command line:
Dir \ -Recurse -ErrorAction SilentlyContinue | Select FullName, Extension, Length, CreationTime, Attributes | ConvertTo-Csv -NoTypeInformation | Out-File C:\AllFiles.csv
That command will take several minutes to run, depending on the number of files on your disk, the speed of the disk and the speed of your computer. The resulting file can get quite big as well. In my case, it took a few minutes and the resulting file size was 135,359,136 bytes (or around 130MB).
Step 3 – Load into Excel and build the right table
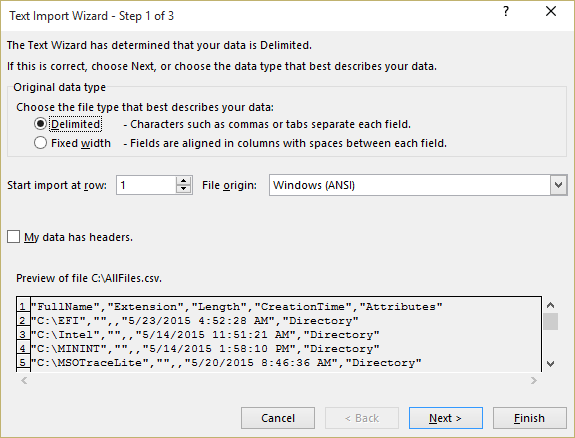
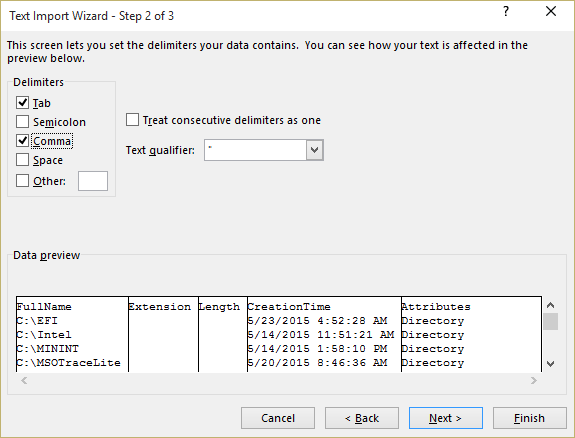
With the AllFiles.csv file available, we can now load the raw data in Excel and start working with it. Just open Excel (I’m using Excel 2016 Preview) and load the CSV file. When importing, make sure to select “Delimited” in the first page of the wizard and check the “comma” checkbox in the second page.
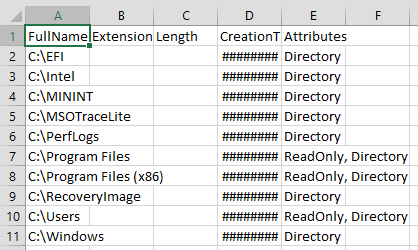
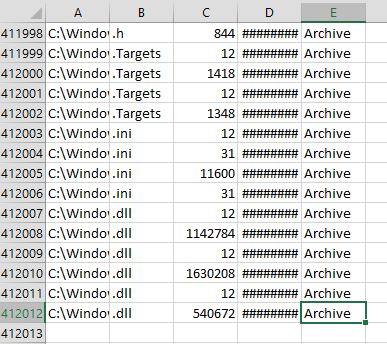
Excel loaded the data and I ended up with 412,012 rows (including one row for the header). However the formating was a little lacking…
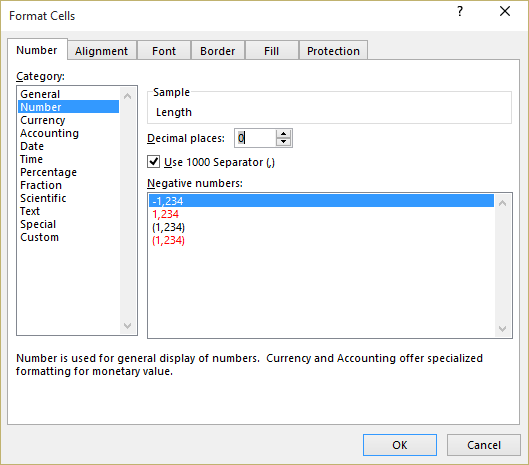
Next, I applied a format each column for best results. You want to format the Length to a number with comma separators and no decimals. To do that, select the third column and click to format as a number.
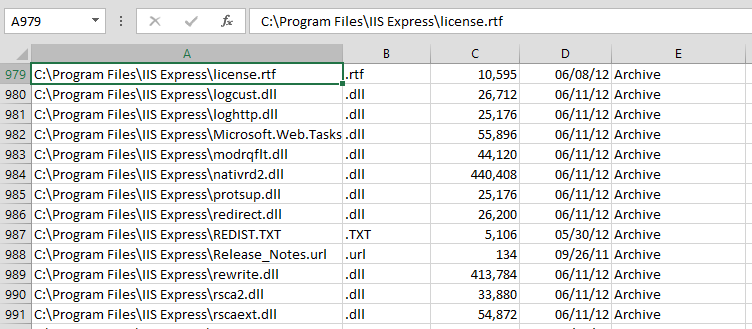
You can also use the same process to format the fourth column with a more interesting date format.
Here’s what it looks like at this point.
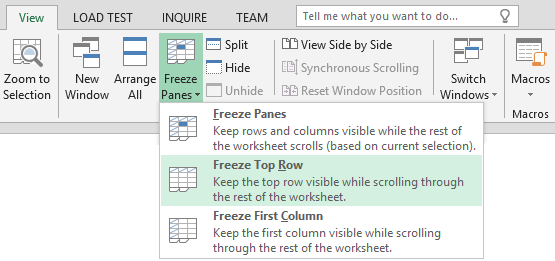
Last but not least, you want to freeze the top row of the spreadsheet and format the whole think as a table.
Here’s the final look for this phase:
Step 4 – Add fields that will help with your questions
While you have most of the data you need readily acessible, it helps to add to your table some additional fields. You could add those to your original PowerShell query, but Excel is probably better equipped to generate those extra columns on the fly.
Also, you might notice the need to add those only after you have played with the data a bit with Excel. That will also give you a chance to brush up on your Excel formula skills. In this example, we will add the following fields to the table:
- CreatedYear – Year the file was created. Formula =YEAR([@CreationTime])
- CreatedDays – Days since the file was created. Formula =TODAY()-[@CreationTime]
- CreatedDow – Day of the week the file was created. Formula = =WEEKDAY([@CreationTime])
- IsFolder – True if the item is folder, not a file. Formula =NOT(ISERROR(FIND("Directory",[@Attributes])))
- TopFolder – First folder in the file name. Formula = =IF(ISERROR(FIND("\",[@FullName],4)),"C:\",LEFT([@FullName],FIND("\",[@FullName],4)))
Just insert the extra columns (right click column, click insert) and fill in the title and the formula. Excel will apply the formula to all cells in that column automatically. You will need to reformat the columns for CreatedYear, CreatedDays, CreatedDow to show as regular numbers, without any decimals.
Step 5 – Create a Pivot Table
With all the columns in place, you should proceed and create the Pivot Table. Just click on a cell at the table and choose Pivot Table under the “Insert” tab.
That will create an empty PivotTable with all the fields on the table available to you.
Now you just have to drag the fields to one of the four white boxes below the field list: Filters, Columns, Rows or Values. You will have options on how things are summarized (count, sum, average), how to format the data, how fields are sorted, etc.
To start, you can drag TopFolder to the Rows and Length to the Values. You should make adjustments to the “Count of Length” under Values to format as a number with no decimals.
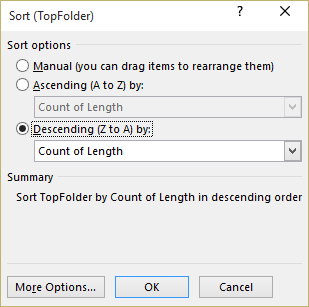
You will also need to change the “More sort options” of the “TopFolder” field to sort on descending order by “Sum of Length”.
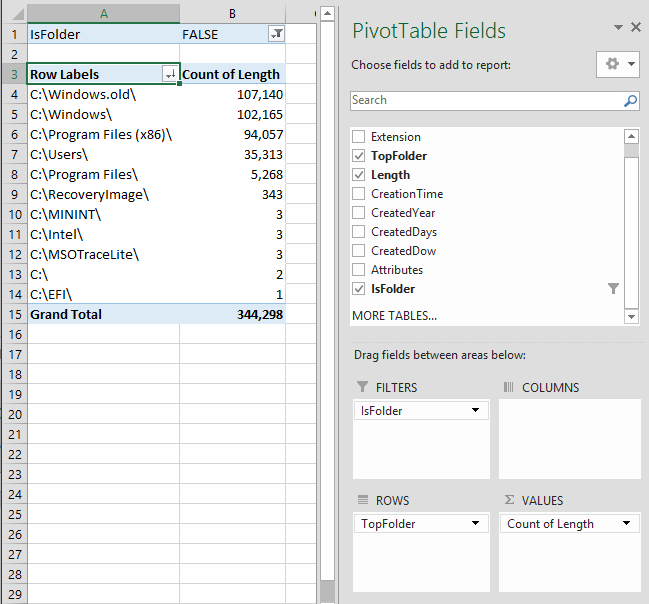
To avoid counting folders, you could add the IsFolder field to the filter box and then click on cell B1 to change the filter to false. Here’s what you should get: A sorted list of top-level folders with the number of files in each.
Simply by changing the settings in “Count of Length” to make it a sum, you get the list of top folders with the total size in bytes for each one:
Those two will answer the first question on our list: Which folder is storing the most files or using up the most space in your local disk?
Step 6 – Tweak the PivotTable to your heart’s content
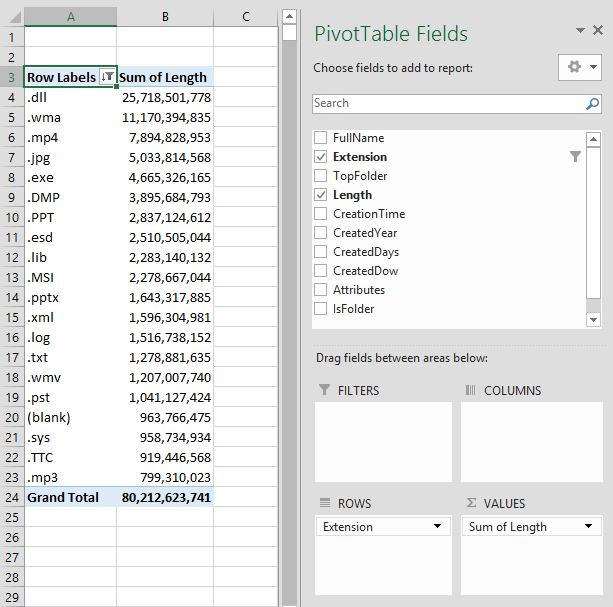
Now you have everything you need to slice and dice the data, answering any of the questions posed at the beginning of this blog. Here are a few examples, with specific comments for each one. Top 20 extensions for all the disk. Start with dragging extension to the rows, then filter by TOP 10 and adjust:
So I have a lot used by programs (DLL, EXE), but also a fair amount of bytes used by music (WMA), videos (MP4) and pictures (JPG).
Next I could filter only to files under the C:\Users\ folder, which would exclude the operating system. After that, PowerPoint files jump up to number 4, right after music, videos and pictures.
If I want to look at the size of a particular kind of file, I would filter by that extension and add a few things to the values. To look at statistics of pictures I took this year, I dragged length to the values a few times and adjusted to do count, sum and max. I also moved the “∑ Values” from Columns to Rows. I finished by adding Created Year to the filters and selecting 2015.
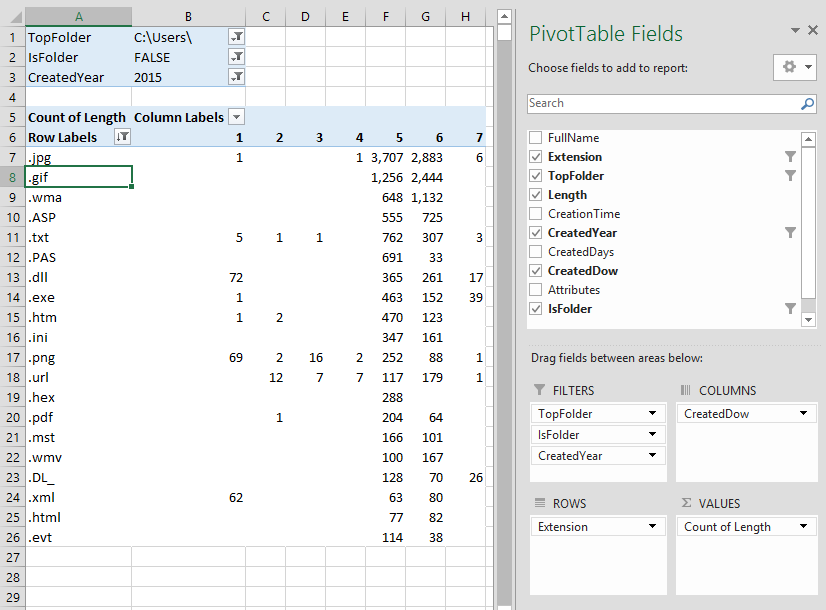
Lastly, I looked at the the breakdown of files by the day of the week they were created. I was looking at the total number of files created in a given day of the week, broken down by the top 20 file extension. I had filters for user files only and restricted it also to files created in 2015. I also removed the Grand totals for this one. Apparently I did a lot of my file creation this year on this computer on Thursdays and Fridays.
Finally, here’s a more complex scenario showing a total of files, capacity, oldest year and largest size. I played with changing the default name of the values, which makes the labels a bit more readable. There’s also multiple items in the rows, creating a hieararchy. I’ll let you figure out how to get to this particular view.
Conclusion
I hope this post was a good example of all the things you can do with Excel PivotTables. In my view, this gets really powerful if you have an interesting data set to play with, which PowerShell and the file system were glad to provide for us. Let me know if you found this useful and share your experience with file/folder statistics, gathering data sets with PowerShell and PivotTables.
For my next data set, I was thinking about gathering some data about e-mails. There’s another thing that everyone has in large quantities…
Comments
- Anonymous
January 01, 2003
@Mark
While I agree that WinDirStat can do most of what I show here, the goal of the blog is to serve as example of what you can do with PivotTables. This is knowledge that you can apply to other areas, where a pre-built application might not be available. - Anonymous
June 01, 2015
WinDirStat - Anonymous
June 02, 2015
Great demo on MS tools, but i would like to point out, that free tools like WinDirStat, SequoiaView and TreeSize are free (and MS Excel does not) and show more information ina easily manner. Recently i had problems with WinDirStar and SequioaView regarding de-duplication, so, in the future maybe only TreeSize it will be usesful and your tip, for sure, it will work in any circustances - Anonymous
June 03, 2015
Genial.
Yo he tenido algunos problemas para traducirlo a mi excel en castellano.
=AÑO( [CreationTime])
=AHORA()-[CreationTime]
=DIASEM([CreationTime])
=NO(ESERR(ENCONTRAR("Directory";[Attributes])))
=SI(ESERROR(ENCONTRAR("";[FullName];4));"e:";IZQUIERDA([FullName];ENCONTRAR("";[FullName];4)))
;-) - Anonymous
June 03, 2015
Nice job but Doug Finke already created a very nice module for that ;-)
https://github.com/dfinke/ImportExcel - Anonymous
June 09, 2015
Kayzer, you should check out this post regarding de-dupe and WinDirStat: https://blog.workinghardinit.work/2015/06/08/windows-deduplication-and-mysterious-folder-sizes/
Basically, MS DeDupe uses the drives system volume information folder to store the duplicated chunks, so when you run those tools under your account, it isn't seeing the full picture. Try running the tool under SYSTEM which should let it scan the folder correctly. - Anonymous
June 30, 2015
Recent Releases and Announcements
Cumulative Update #1 for SQL Server 2014 SP1
https://support
