Windows Azure Debugging: Matching an Instance in the DevFabric to its Process
One of the things I run into from time to time is the need/desire to match an instance I’m watching in the Development Fabric UI back to its process.
This may be because I am sitting on a breakpoint in Visual Studio and want to look at the corresponding logs for that process in the DevFabric UI or because I want to use some non Windows Azure aware tool that requires a process ID.
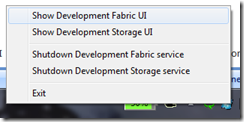
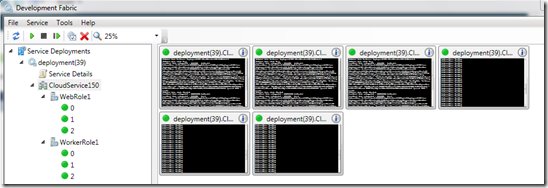
For example, given a Web and a Worker role with 3 instances each, I can watch the instances in the development fabric UI by right clicking on the Windows Azure task tray icon and select “Show Development Fabric UI”:
This is useful for a couple of reasons, sometimes I want to double check the status of my roles and instances but more commonly I want to watch the logs on a per instance basis.
Although the logs are shown in the Visual Studio output window, all of the messages for all of the instances show up there:
Which is fine for the common case where I’m debugging a single instance at a time but not so good as soon as I have more than one instance.
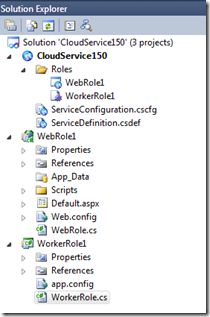
Let’s setup an example, create a new Windows Azure Cloud Service in Visual Studio, add an ASP.NET Web Role and a Worker Role and you’ll have the following in Solution Explorer:
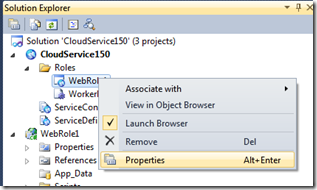
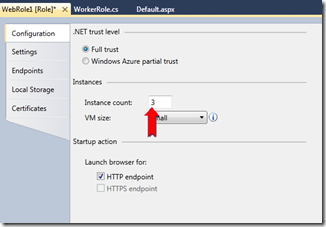
Set the instance count to 3 for each role by bringing up the role configuration UI for each role:
and setting “Instance count” to 3.
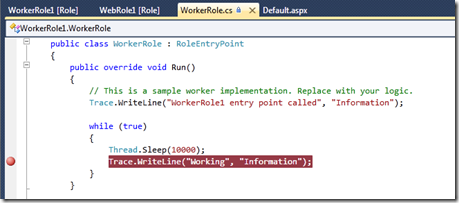
Now I’m going to set a breakpoint in the WorkerRole.cs file in the Worker Role project. You can see that the default worker role code just loops and writes a trace message.
Hit F5 to start debugging the Cloud Service on the Development Fabric.
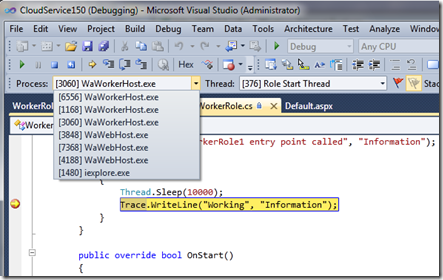
When I hit a breakpoint – I can see that Visual Studio is debugging multiple WaWorkerHost.exe and WaWebHost.exe processes – these correspond to Worker and Web role instances respectively.
But which process corresponds to which logs in the Development Fabric UI?
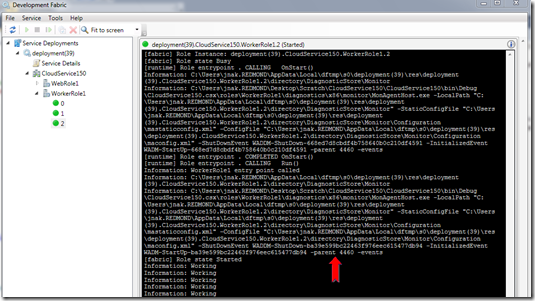
That is, if I’m stopped on a breakpoint for a WaWorkerHost.exe process with ID 4460 – how do I know which log output in the Development Fabric UI corresponds to the process I’m currently stopped on?
As it turns out, there are two ways I can get the information I want -- which is the process ID for the instances I’m looking at in the Development Fabric.
Option 1: Check the log file. If you look carefully, the log file will have the text “-parent xyz” where xyz is the process ID of the WaWorkerHost.exe or WaWebHost.exe that is hosting your worker or web role instance.
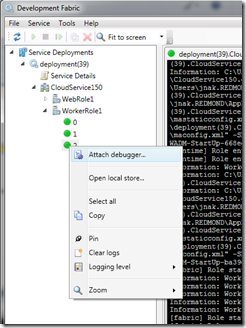
Option 2: Use the “Attach debugger…” functionality from the context menu in the Development Fabric. Right click on one of the instance nodes in the Development Fabric and select “Attach debugger…”
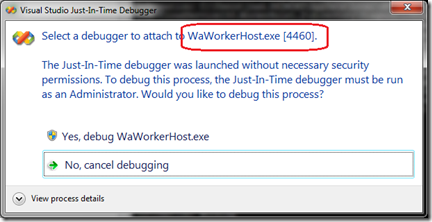
This will bring up a VS dialog that has both the process name and the process ID on it.
I can then use that process ID to correspond an instance in the DevFabric UI to the process I’m stopped on in Visual Studio.
Note: If you aren’t debugging your cloud service from Visual Studio and you choose to use this DevFabric UI option to “Attach Debugger” -- On x64 systems, the “Attach debugger…” functionality only attaches the native debugger so it will appear as though even though you are attached that you can’t hit breakpoints in managed code.
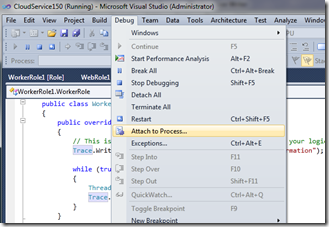
To workaround this issue, make note of process ID and then click “No, cancel debugging”. Open up Visual Studio and select Debug | Attach to Process…
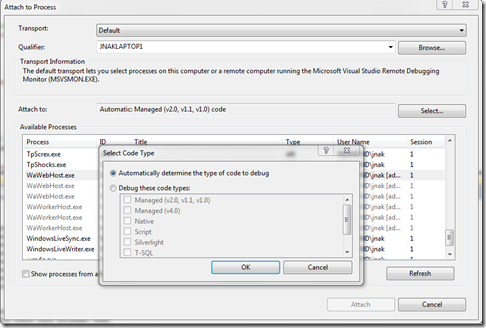
Select the process with the matching process ID and click “Attach”. To explicitly select a debugger, before clicking “Attach”, click the “Select…” button which will allow you to specify which debugger you want to attach.
So far we’ve seen that multiple instances on the development fabric isn’t used nearly as much as doing single instance debugging, however I have a feeling that as more and more apps adopt the Windows Azure scale out model, there are going to be more cases where developers are going to want to test/debug multi-instance scenarios locally.
To that end, I hope this helps and let me know if you think we need to do more for this scenario.
Comments
- Anonymous
January 12, 2011
Unfortunately, the VS dialog with the PID in it is often misleading, catching the process ID of a WaHostBootstrapper.exe and not of the actual WaWorkerHost.exe which you need to attach in order to stop on breakpoints.. So I ended up trying them one by one).
