Walkthrough: Measure the performance of your JScript code with Team System 2010
In Visual Studio Team System 2010, one of the new features that we have added to the Profiler is the ability to measure the performance of JScript code that runs in the browser. This means that if you have a web application that contains ASP.NET AJAX or plain old JScript, you can now measure how long it takes to execute the JScript portion of the application. The main restriction with this feature is that it is only supported for Internet Explorer 8.
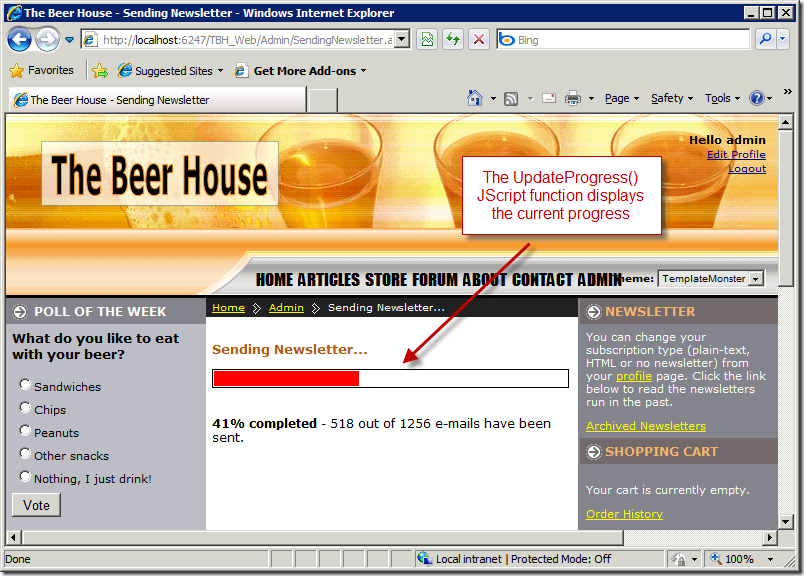
In this walkthrough, I'm using the BeerHouse sample application. Specifically, I want to measure the performance of the UpdateProgress() JScript function by figuring out how many times it is called. This function visually displays the current progress when a newsletter is sent to the list of subscribers. The body of UpdateProgress() is shown below.
    1: function UpdateProgress(result, context)
    2: {
    3:    // result is a semicolon-separated list of values, so split it
    4:    var params = result.split(";");
    5:    var percentage = params[0];
    6:    var sentMails = params[1];
    7:    var totalMails = params[2];
    8:
    9:    if (totalMails < 0)
   10:       totalMails = '???';
   11:
   12:    // update progressbar's width and description text
   13:    var progBar = window.document.getElementById('progressbar');
   14:    progBar.style.width = percentage + '%';
   15:    var descr = window.document.getElementById('progressdescription');
   16:    descr.innerHTML = '<b>' + percentage + '% completed</b> - ' +
   17:       sentMails + ' out of ' + totalMails + ' e-mails have been sent.';
   18:
   19:    // if the current percentage is less than 100%,
   20:    // recall the server callback method in 2 seconds
   21:    if (percentage == '100')
   22:       window.document.getElementById('panelcomplete').style.display = '';
   23:    else
   24:       setTimeout('CallUpdateProgress()', 2000);
   25: }
And here is what the progress bar feature looks like.
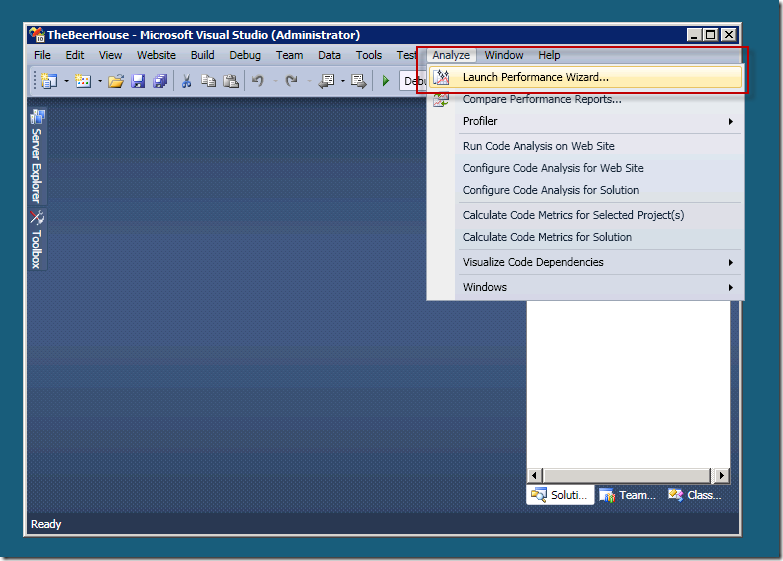
To start collecting performance information about your application, select the "Launch Performance Wizard..." command from the Analyze menu, as shown here.
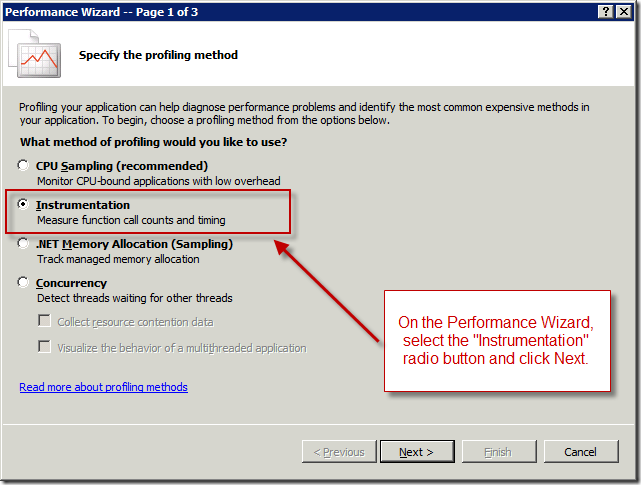
Once the Performance Wizard comes up, select the Instrumentation option and click [Next].
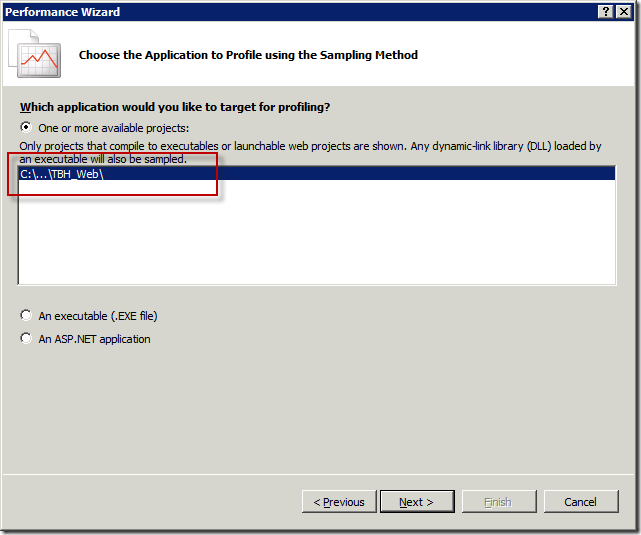
On the second page of the Performance Wizard, you can select which application you want to profile. Since I am profiling the BeerHouse application and it's already open in Visual Studio, the Profiler will automatically select the project for me, as shown below.
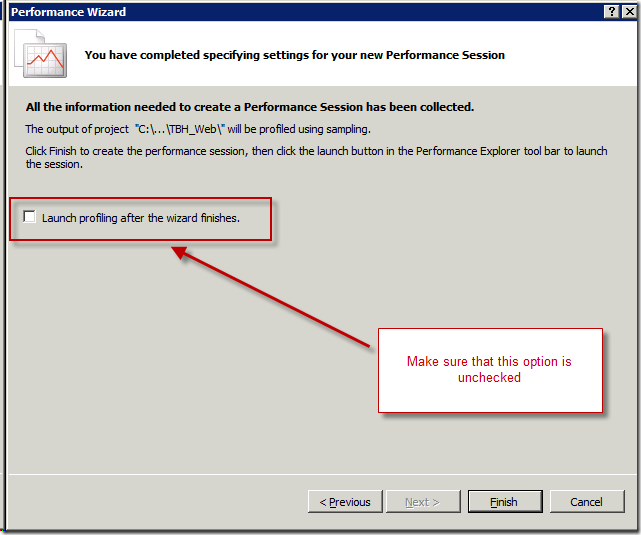
This next step is important! On the last page of the wizard, the checkbox to "Launch profiling after the wizard finishes" is checked. Uncheck it and click the [Finish] button.
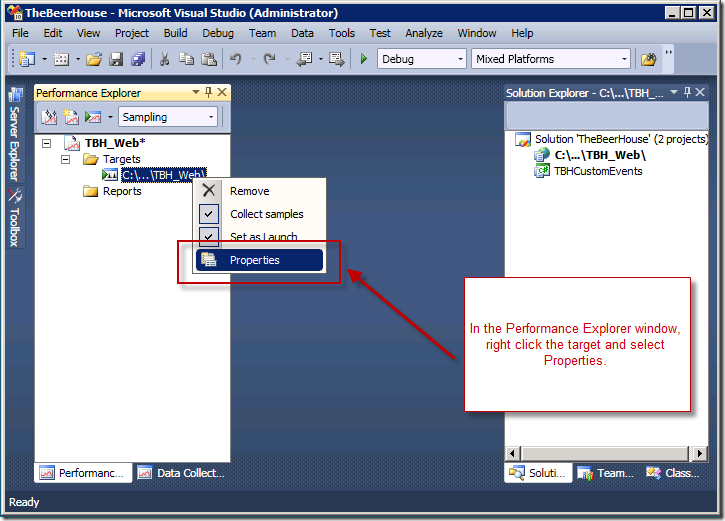
After clicking the [Finish] button, Visual Studio will open the "Performance Explorer" window. In this window, under the "Targets" node, you can see the target application to be profiled . Right-click the target (in this case TBH_Web) and select Properties, as shown below.
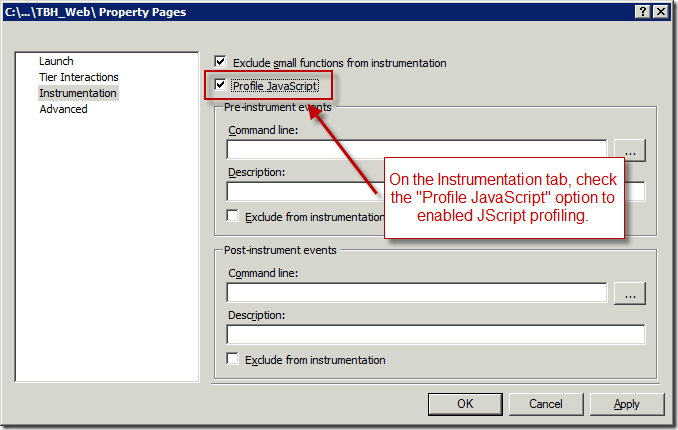
In the Properties dialog, select the "Instrumentation" tab and check the "Profile JavaScript" option. Press [OK] to dismiss the dialog.
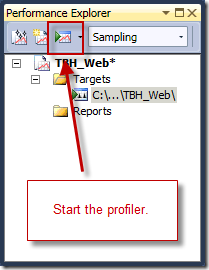
Next, in the Performance Explorer window, click the "Launch with Profiling" toolbar button to start collecting performance data about your application. See below for a screenshot.
This will launch the BeerHouse application and start collecting performance data. In order to capture information about the UpdateProgress() function, I need to exercise the feature by creating a newsletter and sending it to the subscribers of the BeerHouse web site. After completing the scenario, exit the application which will cause the profiler to stop collecting additional information about the application.
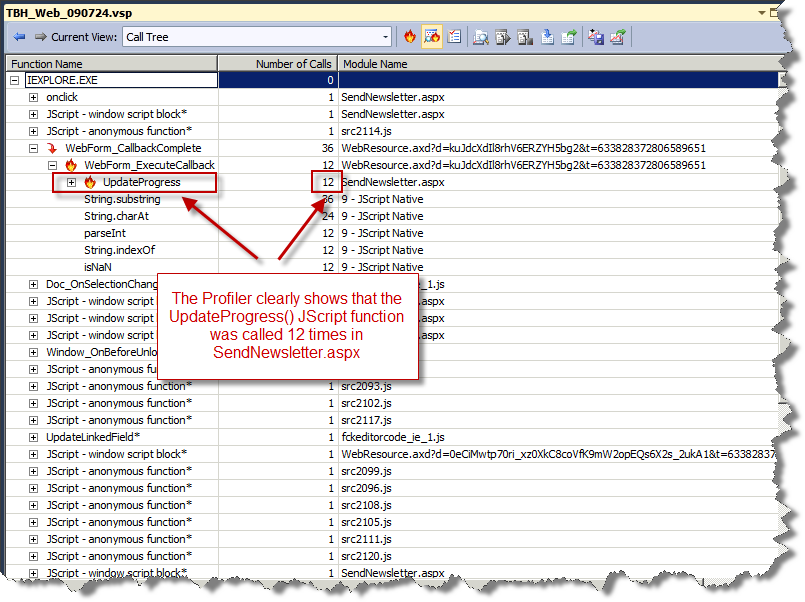
In the screenshot below, I've selected the "Call Tree" view to highlight information about the UpdateProgress() JScript function. As you can see from the screenshot, this function was called 12 times from the SendNewsletter.aspx page. The profiler not only shows how many times this function was called but also how long it took. Using this information, I can now make a decision as to whether to investigate this feature further or determine the performance is fine.
The steps shown in this walkthrough are applicable any time that you want to measure the performance of JScript code running in Internet Explorer 8. The JScript profiler feature is available as part of Visual Studio Team System 2010 Beta 1 which you can download from here.
Habib Heydarian.