IntelliTrace: A graphical comparison
One of the easiest ways to understand what IntelliTrace is and what it does, is through a comparison between how most developers debug their application today vs. what IntelliTrace enables.
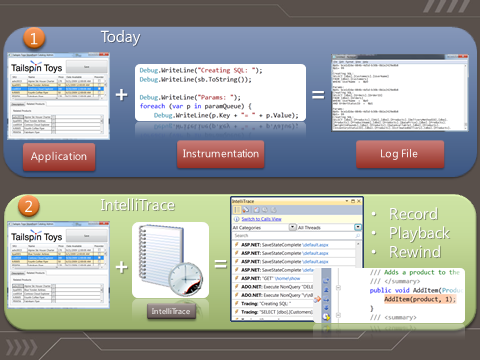
In the figure below, the blue section labeled (1) shows one of the most common ways that developers debug their applications today which is by writing code , e.g. Debug. WriteLine("Calling Web Service") to figure out what the application does.
This is often called "explicit instrumentation" because the developer explicitly adds code to the application to instrument its behavior. After the application runs, a log file is generated which is often just a plain text file that developers view using Notepad. This type of debugging is tedious and it can take a long time to investigate a bug.

In comparison, IntelliTrace alleviates the need to write trace statements just to figure out what the application is doing. In the green section above labeled (2), the IntelliTrace Recorder automatically records what the application does and allows the developer to replay the recording at a later time. Specifically, IntelliTrace provides three capabilities:
- Record
- Playback
- Rewind
What's important to note is that IntelliTrace also provides a rich UI to analyze the application recording. No more wading through volumes of text in Notepad just to figure what the application was doing.
Habib Heydarian.
Comments
- Anonymous
November 25, 2009
thanks a lot for thic article