Send Telemetry to Splunk Enterprise from Azure Resources via Azure Monitor, Part 1
Azure Monitor is Microsoft Azure’s built-in pipeline for searching, archiving, and routing your monitoring data, providing a single path for getting Azure data into 3rd party analytics systems. An open source project has recently published a Splunk modular input, or add-on, that allows users to easily send telemetry from Azure-based resources such as VMs, web sites and many others directly into Splunk Enterprise. If you already know what Azure Monitor is and what an add-on is and you just want to get it, head on over to Splunkbase by clicking here.
This is Part 1 of a 5 part blog series. Here’s the list of links:
- Cloud-based Splunk, using the add-on (Part 2)
- Cloud-based Splunk, using the HTTP Event Collector (Part 3)
- Premises-based Splunk, using private network (Part 4)
- Premises-based Splunk, via the internet (Part 5)
What data can I get from Azure Monitor?
Two types of data can be gotten from Azure Monitor: metrics and logs. There are two types of data sources for logs: Azure resources and your Azure subscription.
If an Azure resource emits logs via Azure Monitor, they are known as Diagnostic Logs. Each log record will be of one log category for that resource type (such as Network Security Group, or Microsoft.Network/networkSecurityGroup). A resource type may emit log records of more than one log category.
Your Azure subscription emits log records for various operations on your Azure resources such as create or update. These logs are known as Activity Logs, though they used to be known as Operational Logs or Audit Logs.
Some Azure resources emit metrics. An example is a VM. VM’s emit metrics such as Percentage CPU or network bytes in or out, and so on.
See here for a complete list of metrics supported by Azure Monitor. And see here for a complete list of Diagnostic Logs supported by Azure Monitor.
Here are a few more links if you want to learn more:
Overview of metrics in Microsoft Azure
Overview of the Azure Activity Log
Collect and consume diagnostic data from your Azure resources
How do I get the add-on and get access to all of this data?
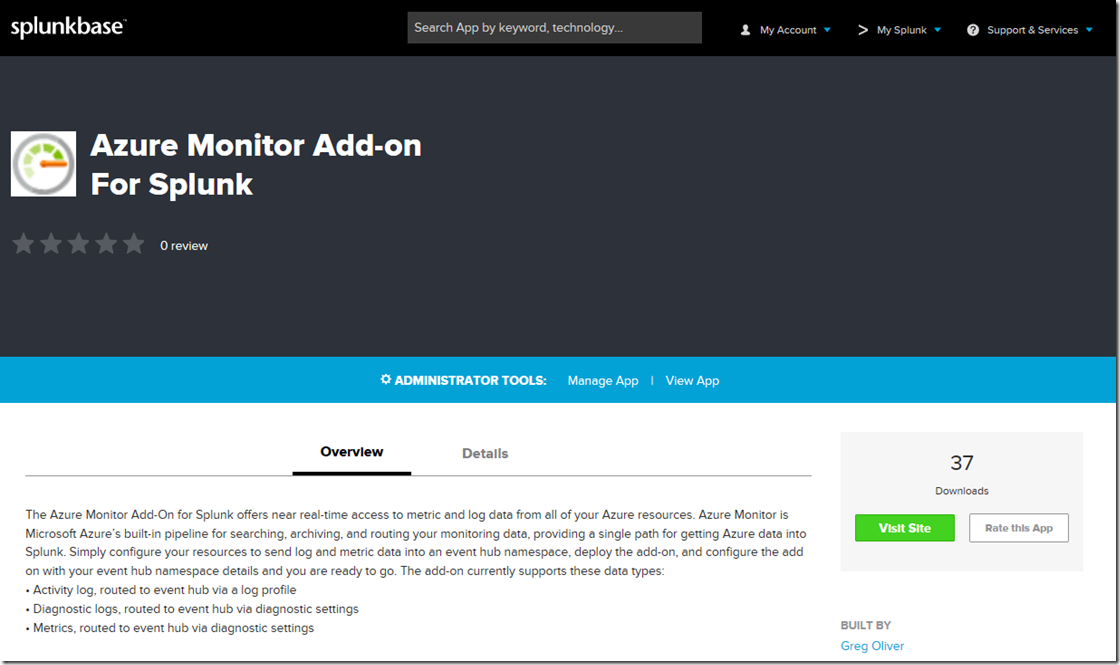
Head on over to Splunkbase here, to read some more details, then click the Visit Site button to get to the Github repo here.
Full installation and configuration instructions are published in the wiki of the repo. Briefly though, download the SPL file from the packages folder of the repo then install into Splunk Enterprise using the Manage Apps page. There will be a couple more steps to install software dependencies onto your system. And there will be a few configuration steps for both Splunk and Azure. It takes less than 10 minutes and it’s all in the wiki.
Cheers!
