Auto-scaling Azure with WASABi–From the Ground Up
(The information in this post was created using Visual Studio 2010, the January refresh of the Windows Azure Platform Training Kit and v1.6 of the Windows Azure SDK in April of 2012. The autoscaler was installed in the compute emulator. The “app to be scaled” was deployed to Azure.)
The Microsoft Enterprise Library Autoscaling Application Block (WASABi) lets you add automatic scaling behavior to your Windows Azure applications. You can choose to host the block in Windows Azure or in an on-premises application. The Autoscaling Application Block can be used without modification; it provides all of the functionality needed to define and monitor autoscaling behavior in a Windows Azure application.
A lot has been written about the WASABi application block, notably in these two locations:
- http://msdn.microsoft.com/en-us/library/hh680892(v=pandp.50).aspx
- https://entlib.codeplex.com/ (PS: this is the place to get support questions answered!)
- Plus a very informative video: https://channel9.msdn.com/posts/Autoscaling-Windows-Azure-applications
In this post, I demonstrate the use of WASABi in a compute emulator hosted worker role scaling both web and worker roles for the “Introduction to Windows Azure” hands on lab from the training kit (the “app to be scaled”). I use a performance counter to scale down the web role and queue depth to scale up the worker. Here are a few links:
- Windows Azure Platform Training Kit: https://www.microsoft.com/download/en/details.aspx?displaylang=en&id=8396
- Adding the Autoscaling Application Block to a Host: https://msdn.microsoft.com/en-us/library/hh680920(v=pandp.50).aspx
- My earlier blog post on Azure Diagnostics: https://blogs.msdn.com/b/golive/archive/2012/04/21/windows-azure-diagnostics-from-the-ground-up.aspx
Here’s an overview of the steps:
- Create a new cloud app, add a worker role.
- Using the documentation in the link above, use Nuget to add the autoscaling application block to your worker role.
- Use the configuration tool (check it out: https://msdn.microsoft.com/en-us/library/ff664633(v=pandp.50).aspx) to set up app.config correctly.
- Start another instance of Visual Studio 2010. Load up “Introduction to Windows Azure”, Ex3-WindowsAzureDeployment, whichever language you like.
- Change the CSCFG file such that you’ll deploy 2 instances of the web role and 1 instance of the worker role.
- Modify WorkerRole.cs so that queue messages won’t get picked up from the queue. We want them to build up so the autoscaler thinks the role needs to be scaled.
- Modify WebRole.cs so that the required performance counter is output on a regular basis.
- Deploy the solution to a hosted service in Azure.
- Set up the Service Information Store file. This describes the “app to be scaled” to the autoscaler.
- Set up rules for the autoscaler. Upload the autoscaler’s configuration files to blob storage.
- Run the autoscaler, watch your web role and worker role instance numbers change. Success!
And now some details:
For #3 above there are a few things to be configured:
Nothing under “Application Settings”. You can ignore this section.
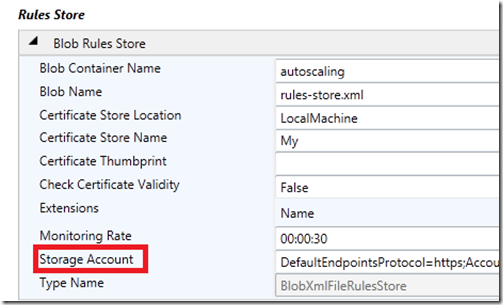
The Data Point Storage Account must be in the Azure Storage Service rather than the storage emulator. The reason is that they’re using the new upsert statement which is not supported in the emulator. (how many hours did this one cost me???)
Your autoscaling rules file can be stored in a few different places. I chose blob storage. It can be either storage emulator or Azure Storage Service. An example of a rule is “if CPU % utilization goes above 80% on average for 5 minutes, scale up”.
The Monitoring Rate is the rate at which the autoscaler will check for runtime changes in the rules. You can ignore the certificate stuff for now. It’s there in case you want to encrypt your rules.
Next is the Service Information Store. This file describes the service that you want to monitor and automate. In it you tell the system which hosted service, which roles, and so on. The same configuration details as those for the rules file pertain.
You can ignore the “Advanced Options” for now.
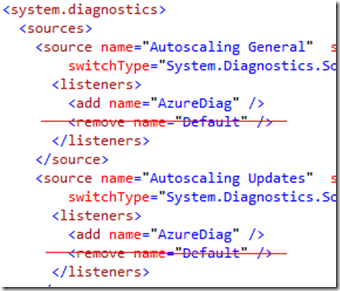
When you’re done with the configuration tool, take a look at app.config. Down near the bottom is a section for <system.diagnostics>. In it, the Default listener is removed in a couple places. Unless you configure your diagnostics correctly, the effect of this is that the trace messages from the autoscaler will go nowhere. My advice: remove the lines that remove the default listener. This will cause the trace messages to go into the Output window of Visual Studio. As follows:
(If you have read my previous blog post about Azure Diagnostics (link), you already know how to get the trace log to output to table storage, so this step isn’t necessary.)
For #6 above, I just commented the line that gets the CloudQueueMessage:
For #8 above, reference my earlier blog post (link) on configuration of diagnostics to switch on the CPU% performance counter. Here are the lines you’ll need to add to the DiagnosticMonitorConfiguration object:
For #9 above, there are a few things I want to point out.
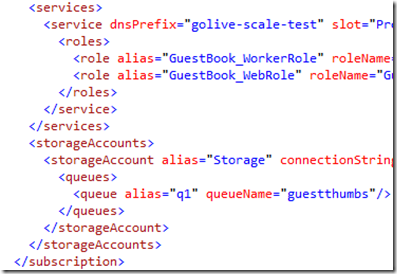
- In the <subscription>, the certificate stuff points to where to find your management certificate in the WASABi host. WASABi knows where to find the matching certificate in your subscription once it has your subscription ID.
- In the <roles> elements, the alias attributes point at (match – case sensitive) the target attributes in your rules in #10 (coming next).
- In the <storageAccount> element you need to define the queue that you’ll be sampling and call it out by name. The alias attribute of the <queue> matches to the queue attribute of the <queueLength> element in the rules file.
For #10 above, this is the fun part. ![]()
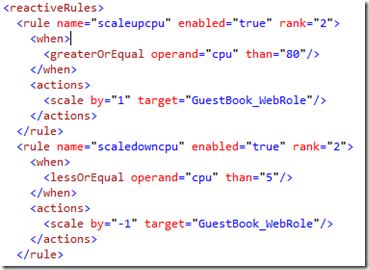
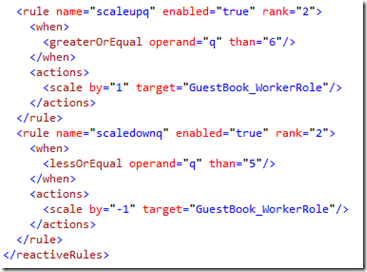
To show the operation of performance counters causing a scaling event, I set up a rule to scale down the web role if CPU% is less than 5%. Since I’m not driving any load to it, this will be immediately true. Scaling should happen pretty soon. To show the operation of queue depth causing a scaling event, I set up a rule to scale up if the queue gets greater than 5 deep. Then I push a few queue messages up by executing a few web role transactions (uploading pictures).
Most folks initially learning about autoscaling wisely think that we need to set up some kind of throttle so that the system doesn’t just scale up to infinity or down to zero because of some logic error. This is built in to WASABi. Here’s how this manifests in this example:
Next, we need to think about how to define the criteria that we’ll use to scale. We need some kind of way to designate which performance counter to use, how often it gets evaluated, and how it’s evaluated (min/max/avg, whatever). The role’s code might be outputting more than one counter – we need some way to reference them. Same goes for the queue. With WASABi, this is done with an “operand”. They are defined in this example as follows:
Here, the alias attributes are referenced in the rules we’re about to write. The queue attribute value “q1” is referenced in the Service Information Store file that we set up in step #10. The queueLength operand in this case looks for the max depth of the queue in a 5 minute window. The performanceCounter operand looks for the average CPU% over a 10 minute window.
You should be able to discern from this that autoscaling is not instantaneous. It takes time to evaluate conditions and respond appropriately. The WASABi documentation gives a good treatment of this topic.
Finally, we write the actual rules where the operands are evaluated against boundary conditions. When the boundary conditions are met, the rules engine determines that a scaling event should take place and implements the appropriate Service Management API to do it.
Note that the target names are case-sensitive. Note also the match between the operand name in the reactive rule, and the alias in the operand definition.
For #11. Run the autoscaler and the “app to be scaled”, upload 6 pictures. Because we’ve disabled the ingest of queue messages in the worker role, thumbnails won’t be generated. It might be easier to use really little pictures. Now sit back and wait about 10 minutes. After about 5 minutes you should start to expect the worker role to scale up. After about 10 minutes you should start to expect the web role to scale down. Watch the messages that are appearing in the Output or table storage. They offer an informative view into how WASABi works. Because the actual scaling of the roles causes all of them to go to an “updating…” status, you might not see the distinct events unless you spread them out with your time values.
Please note this is a sample and doesn’t include best practices advice on how often to sample performance counters and queues, how often to push the information to table storage, and so on. I leave that to the authoritative documentation included with WASABi.
Cheers!
Comments
- Anonymous
May 05, 2012
Good post, Greg. Some additional
- CloudCover episode on Autoscaling (channel9.msdn.com/.../Episode-74-Autoscaling-and-Endpoint-Protection-in-Windows-Azure)
- Windows Azure App Scaling to Need at the patterns & practices symposium (channel9.msdn.com/.../Windows-Azure-App-Scaling-to-Need)
- Energy Efficient Cloud Computing for Developers (bit.ly/Wasabi4EnergyEfficiency) and learning resources:
- Developers’ Guide (entlib.codeplex.com/.../75025)
- Hands-on Labs (www.microsoft.com/.../details.aspx)
- MSDN/TechNet case study (technet.microsoft.com/.../hh975335)

