A Custom Logging Solution for Microsoft Azure
Premise
Have you ever worked on a multi-instanced service and needed to see a stream of logs from all instances merged? Azure Diagnostics Tracing provides this out of the box. See my blog for details on setting this up. To take it a step further, what if you need those merged logs to have precise time measurements so you can see what’s happening, where it’s happening, and when it’s happening relative to activities on other instances? These requirements inspired this solution.
(NOTE: If you’re writing code to look at Azure Table records directly, this can be solved with Trace’s PartitionKey and EventTickCount. Here’s a link if you want to learn more. For my purposes, I want something I can read directly and import into Excel easily.)
Technical Environment
The results presented here were generated using Azure SDK version 2.3, Visual Studio 2013 Update 3, and .NET 4.5. The solution leverages a very solid and reliable subsystem of Windows: Event Tracing for Windows (ETW).
Overview of the Solution
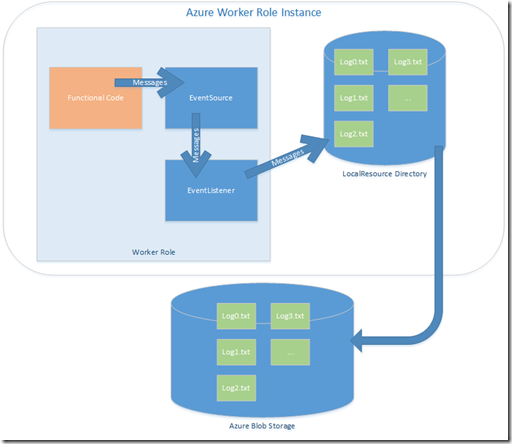
An Azure worker role produces messages. Rather than going to Trace, messages are driven into a System.Diagnostics.Tracing.EventSource. An EventListener is hooked up to receive these messages. The EventListener writes those messages to a StreamWriter, and is configured to write 1000 messages per file to a list of index-named files. Those files land in a LocalResource directory on the compute instance. The Azure Diagnostics system is configured to push the contents of that directory to blob storage each minute. As the directory becomes full, least-recently-used files are garbage collected by the system.
Comparison to Azure Diagnostics Trace
Trace |
Custom Logging |
|
|
Implementation Details
Here’s the implementation in the order that the data flows through the system.
In my system, I started out using Trace.TraceInformation statements. So my code already used a String.Format( string format, object[] ) call structure. I wanted to change as little as possible with these statements. In my custom Logger class, I created a “LogMe” method with the same signature:
 public sealed class Logger
{
    private static readonly Logger instance = new Logger();
    private Logger() { }
    static Logger() { }
    public static Logger Instance
    {
        get
        {
            return instance;
        }
    }

    public void LogMe(string format, params Object[] parameters)
    {
        string content = string.Format(format, parameters);
        soiEventSource.Log.TimeAndString(DateTime.Now, content);
    }
}
The Logger calls the EventSource and serves as an isolation layer. Note that “Time and String” is only one of an infinite variety of event formats that your code can support.
 sealed class soiEventSource : EventSource
{
    private static readonly soiEventSource log = new soiEventSource();
    private soiEventSource() { }
    static soiEventSource() { }
    public static soiEventSource Log
    {
        get
        {
            return log;
        }
    }
    public void TimeAndString(DateTime time, string loggedString) {
        try
        {
            if (IsEnabled()) WriteEvent(1, time, loggedString);
        }
        catch (Exception ex)
        {
            Trace.TraceError("soiEventSource.TimeAndString: {0}", ex.Message);
        }
    }
}
Every EventListener “hears” the feed from all EventSources, unless you specifically filter it out. Since I want my output to appear in an Azure LocalResource directory as text files, I leverage System.IO.StreamWriter.
 public sealed class soiListener : EventListener
{
    const int MAXMESSAGES = 1000;
    private string _name;
    private int _messageCounter = 0;
    private StreamWriter _writer = null;
    private int _fileCounter = 0;
    private string _logFilesPath;

    public soiListener(string name)
    {
        this._name = name;

        LocalResource logs = RoleEnvironment.GetLocalResource("LogFolder");
        _logFilesPath = logs.RootPath;
    }
    protected override void OnEventWritten(EventWrittenEventArgs eventData)
    {
        string content = null;

        switch (eventData.EventId)
        {
            case 1:
                if (eventData.Payload.Count != 2) return;

                DateTime stamp = Convert.ToDateTime(eventData.Payload[0]);
                content = string.Format("{0}; {1}",
                    stamp.ToString("hh:mm:ss.fffff"),
                    eventData.Payload[1].ToString());
            break;
        }
        WriteToLog(content);
    }
    protected override void OnEventSourceCreated(EventSource eventSource)
    {
        EnableEvents(eventSource, EventLevel.Verbose);
    }

    private void WriteToLog(string content)
    {
        if (string.IsNullOrEmpty(content)) return;

        if (_messageCounter >= MAXMESSAGES)
        {
            _messageCounter = 0;
            _writer.Flush();
            _writer.Close();
            _writer = null;
        }

        if (_writer == null)
        {
            string[] paths = new string[] {
                _logFilesPath,
                "logs",
                string.Format("logoutput{0}.txt", _fileCounter++) };
            string fileName = Path.Combine(paths);
            _writer = File.CreateText(fileName);
        }

        _writer.WriteLine(content);
        _writer.Flush();
        _messageCounter++;
    }

    public override void Dispose()
    {
        _writer.Flush();
        _writer.Close();
        _writer = null;
        base.Dispose();
    }
}
The next step is to define the Azure LocalResource directory. This sets aside part of the compute instance’s scratch drive for your app’s purposes. The diagnostics subsystem must also be modified to allow it to monitor the contents of the directory and move the data periodically over to blob storage. It also garbage collects least-recently-used files to keep the size of the contents within limits that you specify. Define the LocalResource in the settings of your role:
The modification to diagnostics directory management is done in diagnostics.wadcfg:
 <Directories bufferQuotaInMB="1000" scheduledTransferPeriod="PT1M">
    <IISLogs container="wad-iis-logfiles" />
    <CrashDumps container="wad-crash-dumps" />
    <DataSources>
      <DirectoryConfiguration container="wad-custom-logs" directoryQuotaInMB="300">
        <LocalResource relativePath="logs" name="LogFolder" />
      </DirectoryConfiguration>
    </DataSources>
</Directories>
As shown above, Diagnostics Directories is aware of LocalResource. The directoryQuotaInMB defines when the garbage collector will activate. The LocalResource size must be greater than the directory quota. The amount greater is defined by the amount of data that will be written into the directory between dumps to blob storage. My scheduledTransferPeriod is PT1M (1 minute). So with the above settings I need to be sure not to write 700MB in a minute.
Consuming the Data
Once the data is in blob storage, it can be consumed in any number of ways. My favorite is Excel 2013. The output is formatted in a standard way, with the Timestamp, Instance ID, Procedure, and Message in all messages, semi-colon delimited. The results are merged after downloading with a DOS statement:
c:> type *.txt >> ..\concat.txt
Bring it into Excel 2013 using “From Text” on the Data tab. Add column headers, convert to a Table, then sort by the Timestamp.
Wrapping Up
There are many workloads that need to get generated file content out of a compute instance and into a location from which it can be easily moved around for consumption. Custom Logging is only one of them. One customer I worked with generates click-stream data from ad placement and monitoring software. This solution easily handles that type of data as well.
Cheers!

