PAL - Performance Analysis of Logs
Keeping track of your infrastructure’s health can easily become a big challenge. More and more applications mean more machines, different requirements and a lot more places to look for when your users call you complaining that something is wrong.
One of the places you’ve probably looked for answers (or were advised to) was the Performance Monitor or Perfmon. Perfmon is a tool provided in your Windows Server which allows you to take a look at some “telemetry” data from your operating system, the Performance Counters. You can find a lot of information regarding things like the system’s Memory, CPU(s) and Disks, but you’ll easily get lost in all the counters available.
Another nice feature of Perfmon is the ability to select some counters and create a Counter Log. The Counter Log is just a periodic recording of the values of the selected counters, which enables you to gather data over time so you can analyze it somewhere else, for example, to create some charts in Excel. You just select the Performance Counters
So, which counters are more relevant? What are the expected values for each counter?
In fact, as any consultant will tell you, it depends. J
It depends on what applications your system is running, the system’s architecture, runtime settings and many other variables. However, there are some guidelines for each counter that you can follow and, in time, you’ll learn to figure them out by yourself, either by your requirements or just by observation of the thresholds at which your application’s performance starts to degrade.
The tool I’d like to point out is specially helpful parsing and analyzing all the Performance Counter data collected and checking it for expected values. PAL is a tool available from Codeplex and developed by Clint Huffman that can really help you. Here’s a rough guide on how you can easily gather performance information from your systems and generate reports based on that data.
1. Go to Codeplex, download the tool and install it. You can check for the latest release here. Just set it up and then start the application. The PAL GUI starts up and you’ll see the first step of its wizard.

2. We don’t have any counter logs to analyze at this point, so the first thing we have to do is go the Threshold File tab and select the type of analysis we want to do from the list of available files.
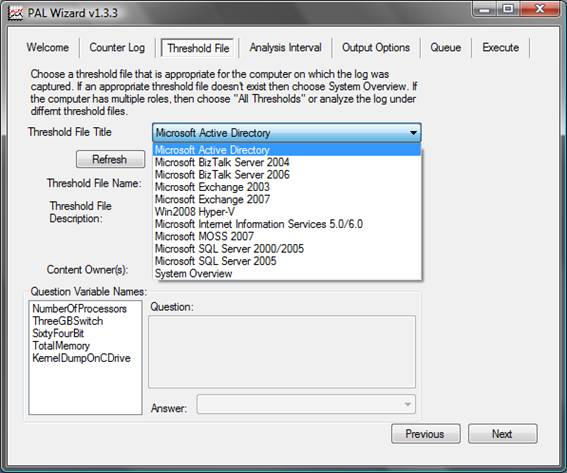
A threshold file is just an XML configuration file, specifying which counters should be monitored and what their expected values are. You can see them and use them to create your own in the PAL installation directory.
3. Here’s where it really starts to get helpful: After you’ve selected the threshold file which suits your needs, click Export and save the generated HTM file in a folder on your hard disk. This HTM file will allow you to automatically configure Perfmon on the servers you want to monitor.
4. Copy the generated HTM file to your server and start Perfmon there (go to Start, Run, type perfmon and click OK).

5. Right-click the Counter Logs element and select New Log Settings From… Select the HTM file above and click OK.
6. Perfmon will import the definitions from the HTM file including the list of counters to monitor, which is a big time-saver. Name the Counter Log and go through the settings and switch as needed. You should probably take a look at the sampling interval, because it can impact the server’s performance if it’s set to a low value, and the schedule (I usually go for something between 20 to 30 seconds, when monitoring for 8 hours). Click OK and you should see your Counter Log on the list.

7. Wait for your schedule to happen (or just start and stop the log manually by right-clicking it and clicking Start or Stop). Note that the counter log is being written to a specific disk location specified in the Log File Name column.
8. After the log is stopped (the icon changes to green when running and back to red when stopped), get a hold of the log file generated and copy it back to your machine, where you were running PAL.
9. Now, you have what it’s needed to go through the PAL wizard. Go to the Counter Log tab and browse to the log file you’ve just copied from the server. You can select multiple files here, as long as they are from the same server.
10. Click Next and re-select the Threshold File. Don’t forget to answer the questions on the bottom of the form. They are relevant to PAL, so that the tool can figure out the expected values for some of the counters.
11. Click Next and select the appropriate analysis interval.
12. Click Next and select the output path for your report.
13. Click Next twice and Execute the items on the Queue. PAL will pop-up a command prompt and start parsing your logs.
14. When PAL is done, go the output directory and open the generated HTML file. Your report is ready!
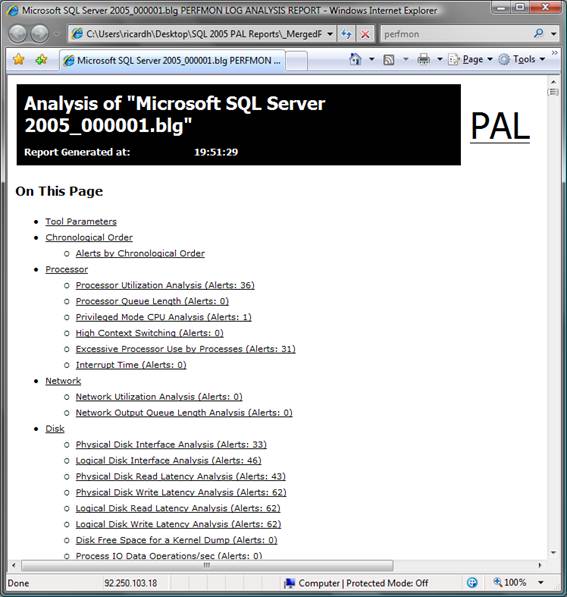
So, what can you get from the report?
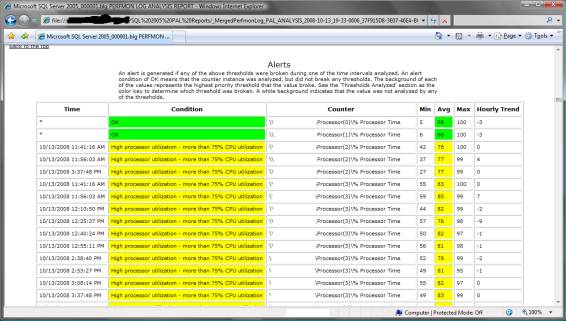
The report will alert for things that were wrong during data collection. It will start with a summary of all the alerts in chronological order:
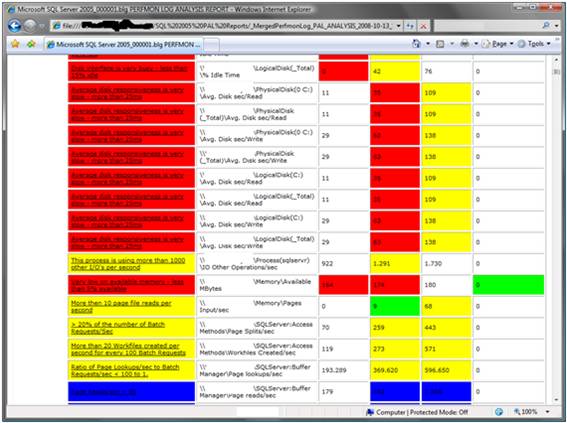
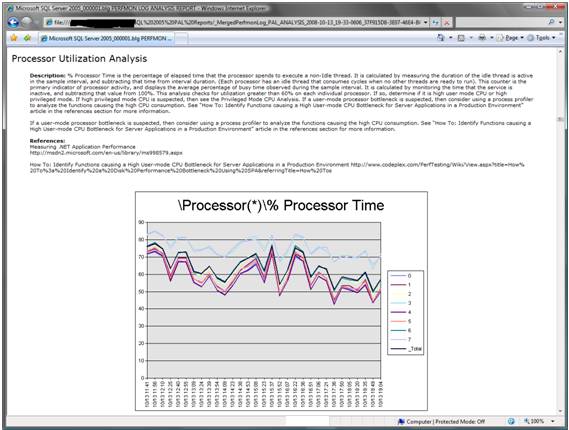
From here, you can navigate to the detail of each counter and see a chart and a table of the recorded data over time.
And that’s it!
Now you can go through your alerts and see what can be improved. You can even schedule this to run once a week and see how the data is changing over time.
I hope I’ve saved you a few conversations with angry users with this guide.
Comments
Anonymous
October 18, 2008
Download details: Office SharePoint Server IT Pro content CHM System.What?: How Well Do SharePoint ListsAnonymous
November 05, 2008
Thanks a lot. I found it very usefulAnonymous
November 26, 2008
Found information on the threshold files very useful.